Target XSS Free Ride to Focus data field (T-XSS)

Here’s my response to the dial/gauge challenge posted on FB Users Group.
My goal was to create something simple to view easily while free riding outdoors.
I don’t think indoors it’s necessary as your workout compliance should ensure all XSS targets are achieved.

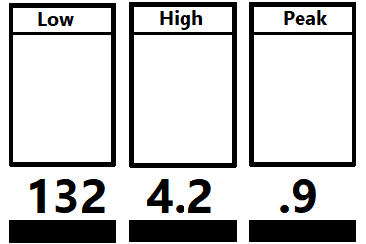
Premise is the data field would sync to XO to gather your signature and training specs for today including XSS, low/high/peak values, and Focus Duration.
Example: XSS 138, 132/4.2/.9 GC Specialist
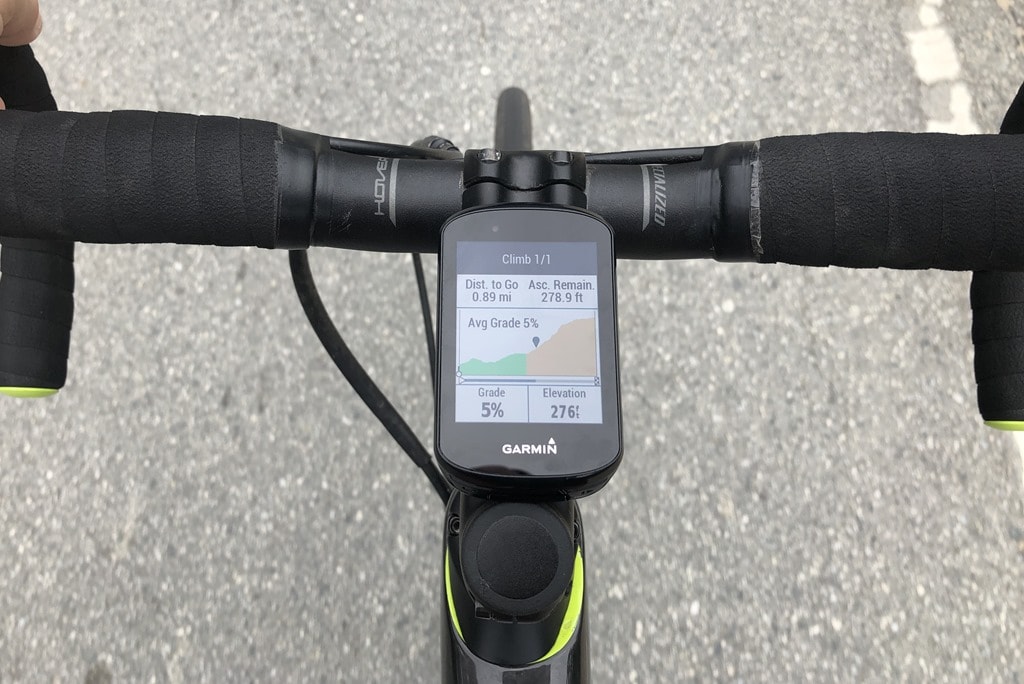
I am assuming a wide data field like this will work on a Garmin head unit and EBC.

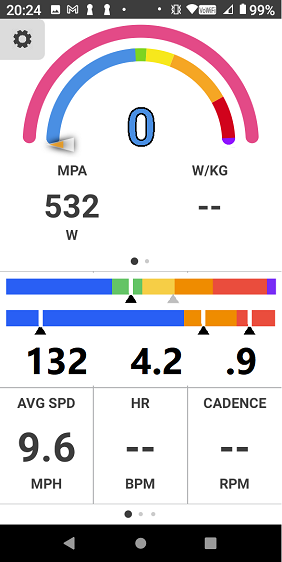
I did not attempt to scale the bars exactly but they would reflect your signature and target ratios accordingly.

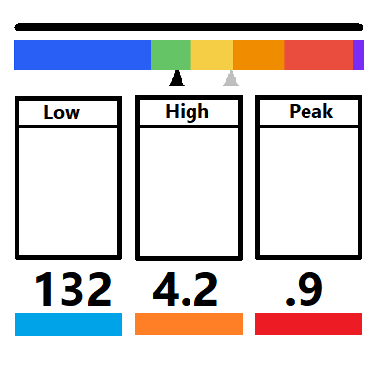
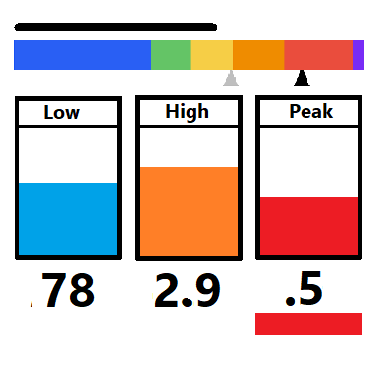
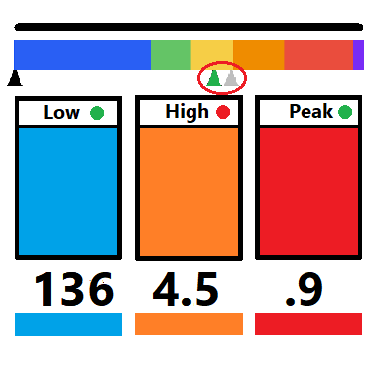
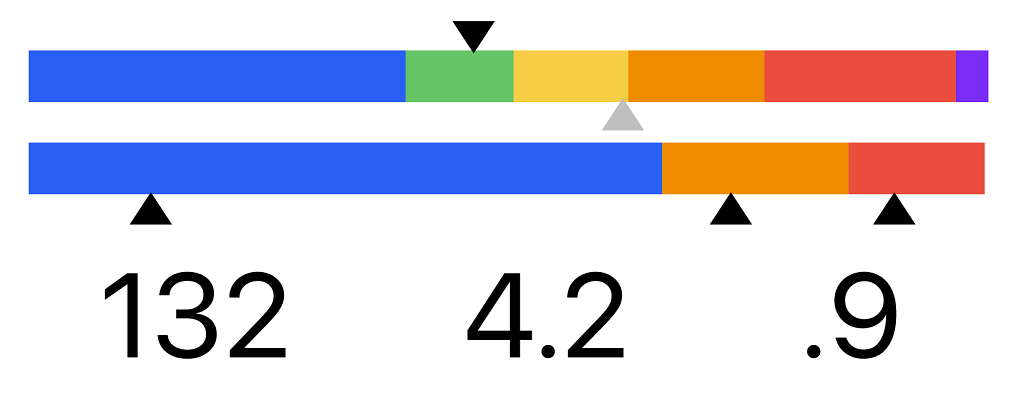
Top bar is current power indicated by black chevron pointing down. You don’t need to see watts as that’s available elsewhere on your head unit.

Grey chevron pointing up is your Focus Duration target for today. For example, GC Specialist = 8 minute power wattage on your power curve.

You could simply free ride and see where things end up, but if you’d like to execute any intervals during the ride the idea is to keep the top chevron above the grey or further to the right.
If the grey chevron is pointed to blue indicating a pure endurance focus, you want to treat it as a ceiling. IRL that’s unlikely to happen but it reminds you where you want to be. :slight_smile:
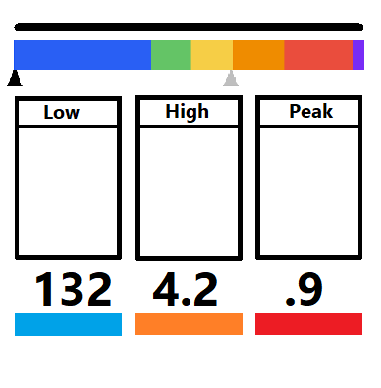
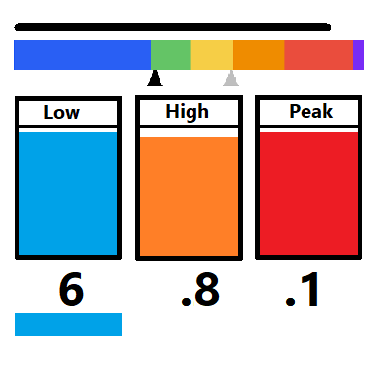
[An additional black chevron on this line could indicate your evolving Forus Duration for the ride with the idea you want to end up close to the grey chevron by ride’s end.]

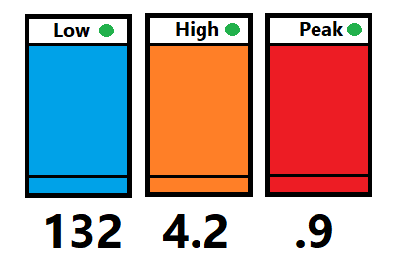
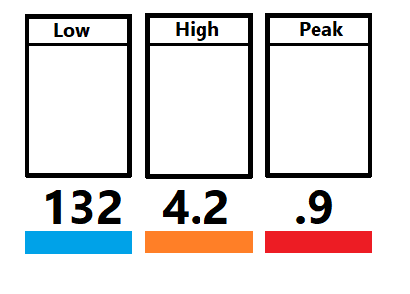
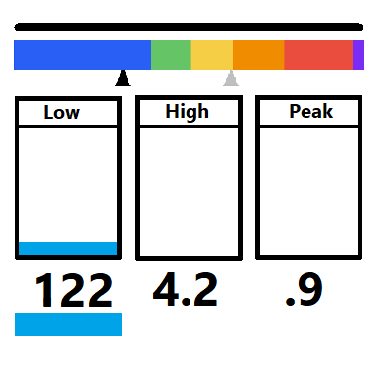
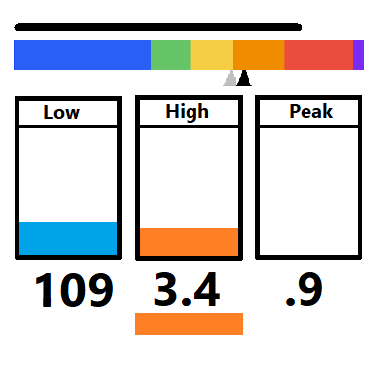
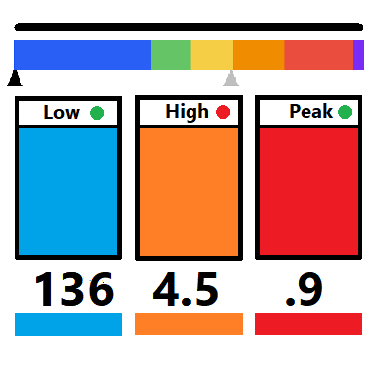
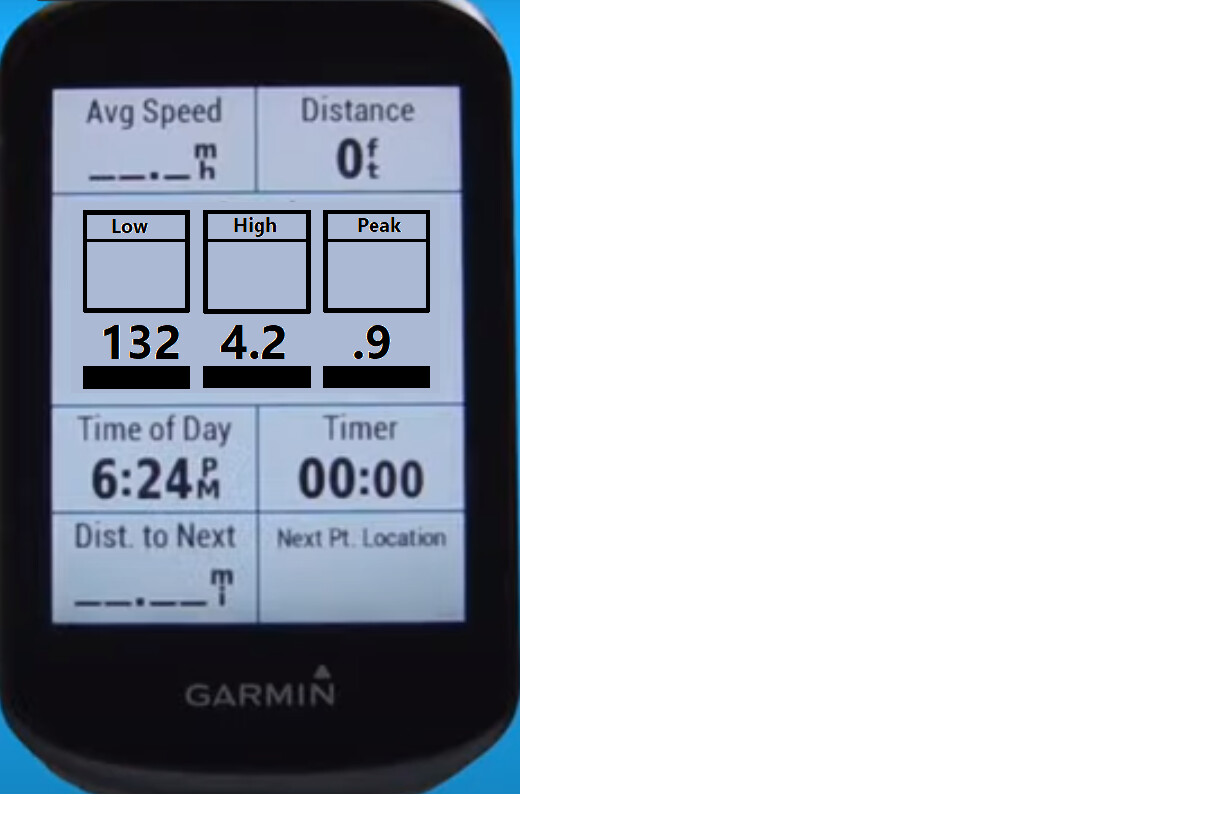
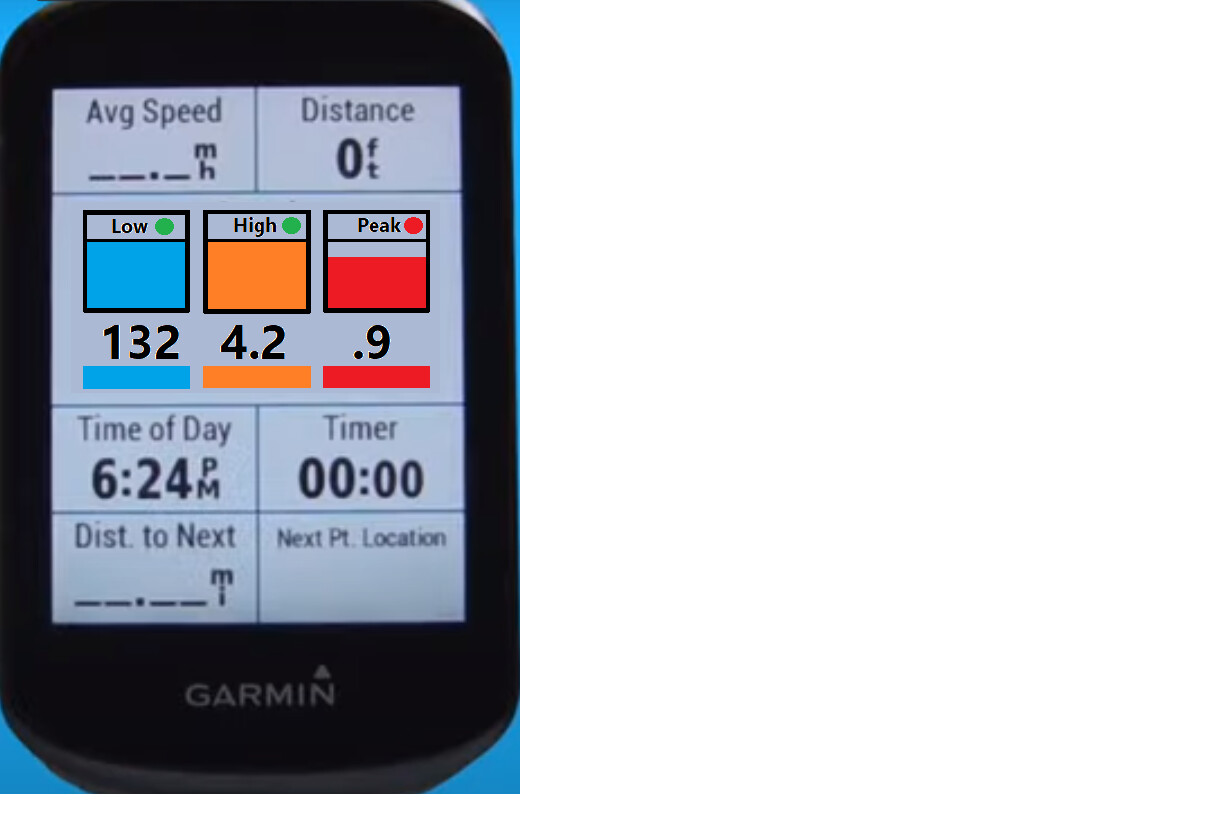
Bottom bar is your XSS target with low/high/peak values. The chevrons start at left of each block and creep to the right as you accumulate strain in those zones. When target strain is reached (100%) the chevron will be at right side of each block. Chevron could also turn to green (target achieved) and potentially go red (significantly over target).

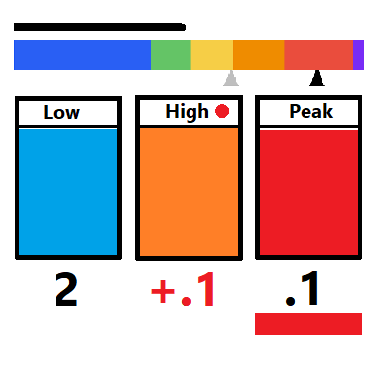
Numbers below are targets for low, high, peak strain. You don’t really need to see total as that should be obvious.
The numbers could also count down to zero if that is a viable approach (goal to zero out by ride’s end). Could also turn red and start counting up if you exceed the target. A red value in this case would indicate XSS in excess. :slight_smile:

Anyway, that’s my take on something simple to glance at while free riding to reach your XSS goal for the day.
I could take it a step further and layer in TTE/TTR running in background to manage the intervals, but that’s another story. :wink:

3 Likes

I am looking forward to having an XSS countdown datafield on my Garmin Edge head unit.

Some suggestions from me:

  1. Put the current (black) arrows on the same side (bottom) to make it clear that both have the same meaning. And then put the grey arrow on the top.
  2. In the XSS countdown indicator you can use a brighter color to indicate the XSS you have completed (same color, but just brighter). Then you can get rid of the arrows.
  3. The same concept can be used in the focus power bar. Make the current power bright, and use the arrow for the target.

Please no countdown. No ride ends spot on and you want to keep seeing how things evolve also past any set goal…
In general I feel it´s overloaded with too many different colors in use. Even on an Edge is would be close to impossible to recognize anything, plus adding some sunshine to the mix. Zero chance for that chevrons.
And then it needs to work on the watch sized displayes, too. Like Fenix, Epix etc.

1 Like

Thanks for the feedback.
The colors match Xert’s matchstick and rainbow gauge scheme.
They could be brightened up a bit. I used default entries on a color wheel.
There’s always an issue of color-blindness for some users, but the blocks are also positional.
Am I halfway to target pts? Almost there? No peak strain today?

The rainbow bar pointer is dynamic (watts) while the grey pointer is static (Focus Duration).
XSS pointers would move very slowly as you complete each block.
All you want know is how far along you are in reaching your XSS pts (low, high, peak).

Goal is a gauge for outdoor free rides not following a structured workout but it could work for both.
I wanted something easy-to-read from a foot away. I think I accomplished that with an appropriate device.
Perhaps I’m biased from using EBC as my head unit, but this is what the gauge would look like on my Kingkong Mini 2.

Actual size on a KKM would be 1.75 in/45mm wide; close to an Edge 1030.

I don’t think I’d have a problem glancing at this during a ride to check how my free ride is going.
The top bar is redundant on EBC, but this allows you to monitor “relative” watts while viewing the map page. Plus, the rainbow gauge would be useful as a Connect IQ data field. You want to know which watts “zone” you are riding in. Exact watts aren’t crucial.

Countdown IMO could be useful. Not sure I’d want to stare at 132 | 4.2 |. 9 for 2+ hours during this example ride. If there were a countdown, you’d know pts remaining to reach the strain goal (at zero). Then it would start counting up in red (excess XSS pts).

I wanted something that also supports free riding to Focus. If you’ve never done that you’ll be scratching your head, but I find it useful to do. I have a favorite 45-mile loop I can ride to various Focus Durations. It’s still a free ride but a free ride with purpose. :joy: To support that I’d an additional thin bar along the top for TTE/TTR. Start an interval and the bar starts to shrink. Ease up for a RIB and it returns to full length (time for another interval as terrain/traffic allows).

If I nix the Ride to Focus idea, here’s my take on a simple triple vertical gauge for XSS only.
Should work as a watch gauge too, but how many cyclists ride only with a watch?

Ride completed with a High strain overage --.
ezgif.com-optimize

Perfect score :smiley:
T-XSS_Vertical_Perfect

Alternate format –
T-XSS_Vertical2

Or this one. My final answer? :laughing:
T-XSS_Vertical2FocusTTE

1 Like

Great ideas RR! We are looking to do something here. Would be good to provide some indication of what power to target that helps close the gaps. Not always or often even that it’s the focus power.

1 Like

Whatever happens, keep it simple. Looking at color coded bar graphs on a Garmin while out riding would likely prove difficult. I’d tend to something boring like % complete of each low/high/peak for what was prescribed that day - whether truly free riding or part of a workout - structured or free ride workout.

1 Like

Yes. Cognitive load needs to be minimized. Agreed.

I’m EBC-centric. Color brings it alive. :wink: (Sold my Edge 1030 long ago.)
In deference to Garmin folks, this design could be greyscale or b&w wireframe with slight modification and still work as intended. Most everything is positional.

Keep in mind you aren’t staring at this gauge. You’re glancing at it from time to time to see how you’re doing and what respective wattage/effort contributes to low, high, and peak strain targets.

Your fitness signature and today’s targets are loaded during XO sync prior to the ride.

Here’s some sample snapshots from a simulated ride –

Today’s Target XSS and Focus Duration (5 min power - Breakaway Specialist).
T-XSS_Vertical2FocusTTE_1
Starting easy. Countdown begins in the blue block.
T-XSS_Vertical2FocusTTE_2
Interval effort just above Focus Duration target.
T-XSS_Vertical2FocusTTE_3
Sprint effort. Roller attack. :grimacing:
T-XSS_Vertical2FocusTTE_4
Recovery time near LTP.
T-XSS_Vertical2FocusTTE_5
Almost there. Sprint for the town line. High strain is now slightly over target.
T-XSS_Vertical2FocusTTE_6
All Done! How’d I do?
T-XSS_Vertical2FocusTTE_7
All together now:
ezgif.com-optimize

IRL the high/peak targets would be higher for a Breakaway Specialist workout relative to low, but I already had first mockup and didn’t want to tweak everything from scratch.
The pointer would also be twice as large extending into the rainbow band. I.e. very obvious where you’re at watt-wise. Again, already had a mockup and didn’t want to start from scratch.

The results will vary greatly depending on whether you achieve targets or go off script and simply ride a route as you’d like. Either way you can glance to see low/high/peak block status and which block you’re filling with your current effort.

This ends my hobby project for today. :laughing:

4 Likes

Sometimes though the target power can be much higher than the FD for the training. For example, if your high is filled but your peak isn’t, you can add peak strain with pure sprints and get back to compliance.

In on a Garmin Edge 1040. I typically have the a summary page and a lap page. I normally have the lap page open. In the summary page I show the total time, distance, XSS or TSS+++.

In this case I just want to have a datafield that I can show in the summary page to check in on the total once in a while during the ride. It will be one out of many fields on this page, so it cannot be very big.

For Garmin I think you should have separate simple datafield for unrelated information.

Yes, that would happen organically.
Your goal today is to fill each bucket with a target value > 0.
No need to make the buckets proportional. Half way filled is half done for that bucket.

I didn’t mean to imply “interval” efforts would cluster only at FD target. Anything at FD or higher will contribute to High and max efforts to Peak.
Fill your High/Peak buckets early on in the ride if you want, then ride back easy until Low fills. Extend your cooldown if necessary and you have the time.

I think it would be very easy to monitor the buckets AND respective watts and TTE/TTR if you’d like to ride irregular intervals to match FD more closely. Otherwise just focus on the buckets.

I forgot to include estimated FD when ride is completed. How close is my ending FD to the target today? Green pointer if close, red if significantly under/over. No need to monitor this during the ride. Filling the buckets should suffice.
Ending FD is simply an estimate. XO analysis will fine tune the results when the ride is uploaded.

T-XSS_Vertical2FocusTTE_7Bcircled
You could use three semi-circles to accomplish the same, but that would take up a lot more space to fit three across.
TSS_Semicircle

I kinda like the concept of “fill the buckets”. What’s my bucket list today? :wink:

bucket bucketOrange bucketRed

A simple Garmin data field for XSS buckets only would look like this –

T-XSS_Vertical2FocusTTE_1_Garmin

Again, black bar would appear under the bucket you are filling at current watts/effort.
Block dots would appear in titles if target is reached. If over target use + sign.

For EBC I really hope you consider the enhanced version with TTE/TTR bar, rainbow power bar, and FD functions. MPA (running in background) could also come into play with purple zone expansion triggered on rainbow when potential BT is detected.
Essentially, you’ve gamified Free Ride to Focus. :+1: :man_cartwheeling: :zap:

This scheme would also work to free ride indoors.
Select a Free Ride Endurance workout from the library as your Play Now selection,
Ride in Slope mode and start filling your buckets while you watch whatever you want on your big screen (movie, TV, YT, virtual world).
End the workout when you’ve filled the buckets for today.

1 Like

please make this happen asap. I prefer to only freeride outside. I’ve basically been doing what’s described here “blind” since I only have total XSS on my screen. It’s possible to do a structured workout outside but only if I want to ride to a long climb and go up and down all day, otherwise my terrain in the mountains is too varied. Having high and peak strain targets and total on the screen somehow would be the final piece needed.

This looks very big for a data field on a Garmin. Remember that this will be used on Garmin Edge 530 and better. The screens are not that big, and you do not want to have a separate page for this.

An alternative is of course to have a few alternatives, and then the user can choose. But that is more things to maintain for Xert.

Why do you think having a separate page for it won’t work? On a Garmin you can have as many pages as you want and I think most people have more than one and switch between them while riding.

I personally would prefer if it was not quite the whole page, maybe one line with two normal fields (power + heart rate maybe or whatever one thinks most important) plus the MPA and XSS stuff. And my 830 is I think the same size screen as a 530 and it does color coding quite ok, not as brilliant as an OLED smartphone of course but usable.

The chevrons might be hard to see on a small screen at a quick glance but the three buckets would be pretty cool and should work on an Edge, even if it’s not one of the biggest ones.

Of course you can add a separate page for it. I just don’t like to have too many pages because it get’s cluttered. If you have too many pages it takes some time to browse open the correct page. I have a Garmin Edge 1040, but I like to keep it simple :slight_smile:

I continuously look at the power, MPA, cadence, and heart rate while riding. Then I might check in on some of the other less important things once in a while, such as how much time I have spent, how far I have ridden etc. For me XSS is one of these things, not important while riding, but nice to have a look at. So I do not want to have a separate page for it and I do not want it to take up too much space.

Does Garmin force you to lose space with a header title or can the large data field be filled with whatever you want?

Garmin 530/830 mockup –


The point of this data field is you WILL want to monitor it while riding to see how current watts/effort is adding to which bucket. Or which bucket needs your attention if you want to fill in the buckets in proportion to today’s targets.

OK simple data fields with the three different xss values are probably not too complex to provide, or one line with all three values. The current Xert data fields are all lines with two values anyway, so not ‘normal’ Garmin fields.

I think that’s not what ridgerider2 was going for here. More a specialized ‘ride to focus’ display with the new data to perform on the fly not-quite-workouts but achieve the same training value outdoors.
Like what Subluxator said above. Riding outdoors in complex terrain with traffic and other real world stuff but still wanting to do the prescribed training by doing some intervals with the more or less correct power to fill up the requirements where possible and knowing when one is ‘done’ with the high and peak stuff and can just mosey on home, or do another turn round the block to fill up the low requirements if necessary.
A dynamic guide to XATA low high peak XSS based training outdoors without a fixed workout. And if one wants to do that one can probably spare a whole page or close to it for that.
I like to keep it simple as well but I think up to three pages are easy enough to navigate so there is some room on a Garmin Edge.
I might try to ‘fill the buckets’ on my (occasional) commute if it was offered, there are some stretches of bike path with little obstacles that would work for some sprints or intervals, I’d never try a real workout though since there’s too much roads with traffic in between and it would be far too dangerous there.

1 Like

The Edge 530 has a color screen same as the 830 (just no touch screen):
Here a photo from dcrainmaker’s as always excellent review:


…and this device is over 4 years and one generation ‘old’.

There is a smaller Edge 130 Plus that’s grayscale:

:smiley: Ride ended. Here’s how you did.

I think you can get rid of the header if ultimately use a graphics field. But you can only select between a few predefined layouts.