- I like the 3 buckets idea
- i would have this datafield on the same page as the TTE/TTR datafield, they go hand in hand for me (esp the middle bucket i expext will be highly correlated with 3-10 min intervals where the tte/ttr datafield also reaaly shines.
- not clear to me how/if this datafield will adjust to an effort on the fly. I mean: with TTE the timer goes down immediately when hitting a certain power. I dont know if the 3 buckets can be assigned directly onto hitting a certain power, or if its rather the outcome of a calculation of some sort. Also not clear to me if the effort levels are fixed or change as you get more exhausted. With fixed i mean like the fat/carb: a certain window of watts is more fat, another is more carbs. With change i mean like the power: the power zones go down as you mpa gets drained. A wattage that was yellow when still fresh becomes a purple effort when completely drained (and turns back yellow once recovered from that interval)
When riding outside, the carb fat datafield, where the one or the other gets in red bold font when you hit that zone is a perfect way of maximum info and useability on minimal screen-estate. The TTE / TTR datafield is another example of a field that gives me a very direct feedback that i can use to really finetune an effort during a free ride.
Looks good. Bonus points for adding freshness/form. That would allow to maximize high/peak intervals out without diving too deep into yellow
If you combine that with the existing MPA/Power (already color coded text)
and TTR/TTE fields. Maybe it could get ‘suitable’ values from XATA for the day instead of manually setting some? But I’ve never used it so I don’t know, always seemed too much hassle.
you still have one line left for heart rate and cadence or whatever else one might want.
At least on a 530/830 assuming the new buckets are two lines high.
That would exactly be my screen setup (incl the HR, the cadence id possibly change for another, like distance to next if im dependant on navigation for my route)
I think the Low, High, Peak as shown above by ridgerider2 on the Garmin 530 would work really well for myself for outdoor rides (I have a Garmin 530). Looking forward to this being implemented soon as it will mean that I can ride outside more and achieve my XERT training goals.
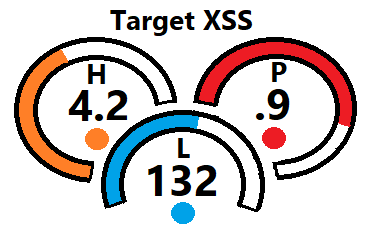
Here’s an alternative Target XSS only version using semi-circles.
I’m not particularly a fan of this option, but I thought I’d try it. ![]()

In this case the dots would serve double-duty.
At start-of-ride you’d see the three colored dots and empty semicircles.
As you start riding only one dot would display based on the watts contributing to the associated semicircle the most. In some cases the dot will be flipping between semicircles (as will the bars in the bucket mockup above). For example, you may be surging on a climb.
At end-of-ride the dots would be green or red indicating compliance to target. There could be a green dot for Peak if the target was 0 and you managed to avoid the temptation to sprint. ![]() OTOH all dogs are wolves at heart. Red points may be a necessity.
OTOH all dogs are wolves at heart. Red points may be a necessity. ![]()
I hit my highest power in 2023 while sprinting away from a very big German Shepherd dog ![]()
Appreciate all the ideas! We’ll look to consolidate the ideas and match with what we can accomplish and support given our resources. Garmin Connect IQ isn’t the best environment for application development so we may have to make some concessions unfortunately.
One more for the road.
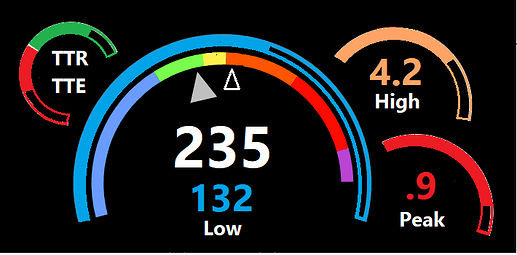
Took the gauge from the Session Player and repurposed it so this is a Xert themed scheme. ![]()
This one has everything to support a free ride to focus and/or target XSS values.
I would have preferred a white background but I didn’t want to spend too much time on it.
TTR/TTE needs some explanation. You’d only see one or the other filling the semicircle portion depending whether you are draining yourself with an effort above TP (TTE red) or recovering below TP (TTR green).
While you could show time like the standard TTE/TTR fields work, as a “free ride” tool you only need to know how close you are to failure versus fully recovered. In practice you’re not trying to reach your failure point nor necessarily make a full recovery before each effort.
As you ride XSS targets are declining to zero as explained in posts above and there could be colored dots to indicate how well you matched targets at ride’s end.
Really looking forward to seeing this when it happens. To be see how much Low, High and Peak is left to achieve out on a ride to meet a days training goals will be amazing
Any news on the development of this?
It’s a work in progress! No ETA yet. We’ll be posting once we have an update to share!
came here to see if there is any date known. Like many other’s I’m looking FWD to this ![]()
Same here, Bruno. Especially with the warmer weather coming and getting out more (hopefully…)
Looking forward to this. Really useful. Be nice to know how much i need to flog myself.
Special thanks to @ridgerider2 and others that contributed to the ideas that went into our new XSS Buckets data field. The data field has been a resounding success! @dbrillha Where it all started. ![]()
