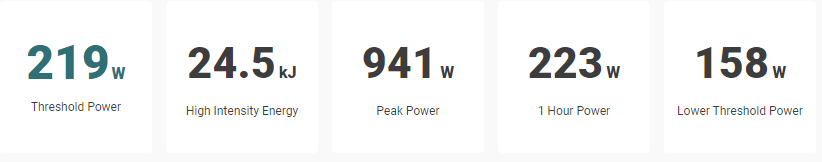
Hi, because of my goals, I believe TP and HIE are the most relevant elements of my signature. I have a clear idea on TP and the level I can realistically expect. I understand the HIE concept, but I have no idea what the expected level for someone of my weight (81kg) and age (58) would be. Is 24.5 kJ an acceptable level, or does it need specific work to improve?
Per this Xert Article:
if your High Intensity Energy is overestimated, your Threshold Power may be underestimated.
Not sure how u got your latest BT,but my guy feeling is your TP is to low & HIE to high.
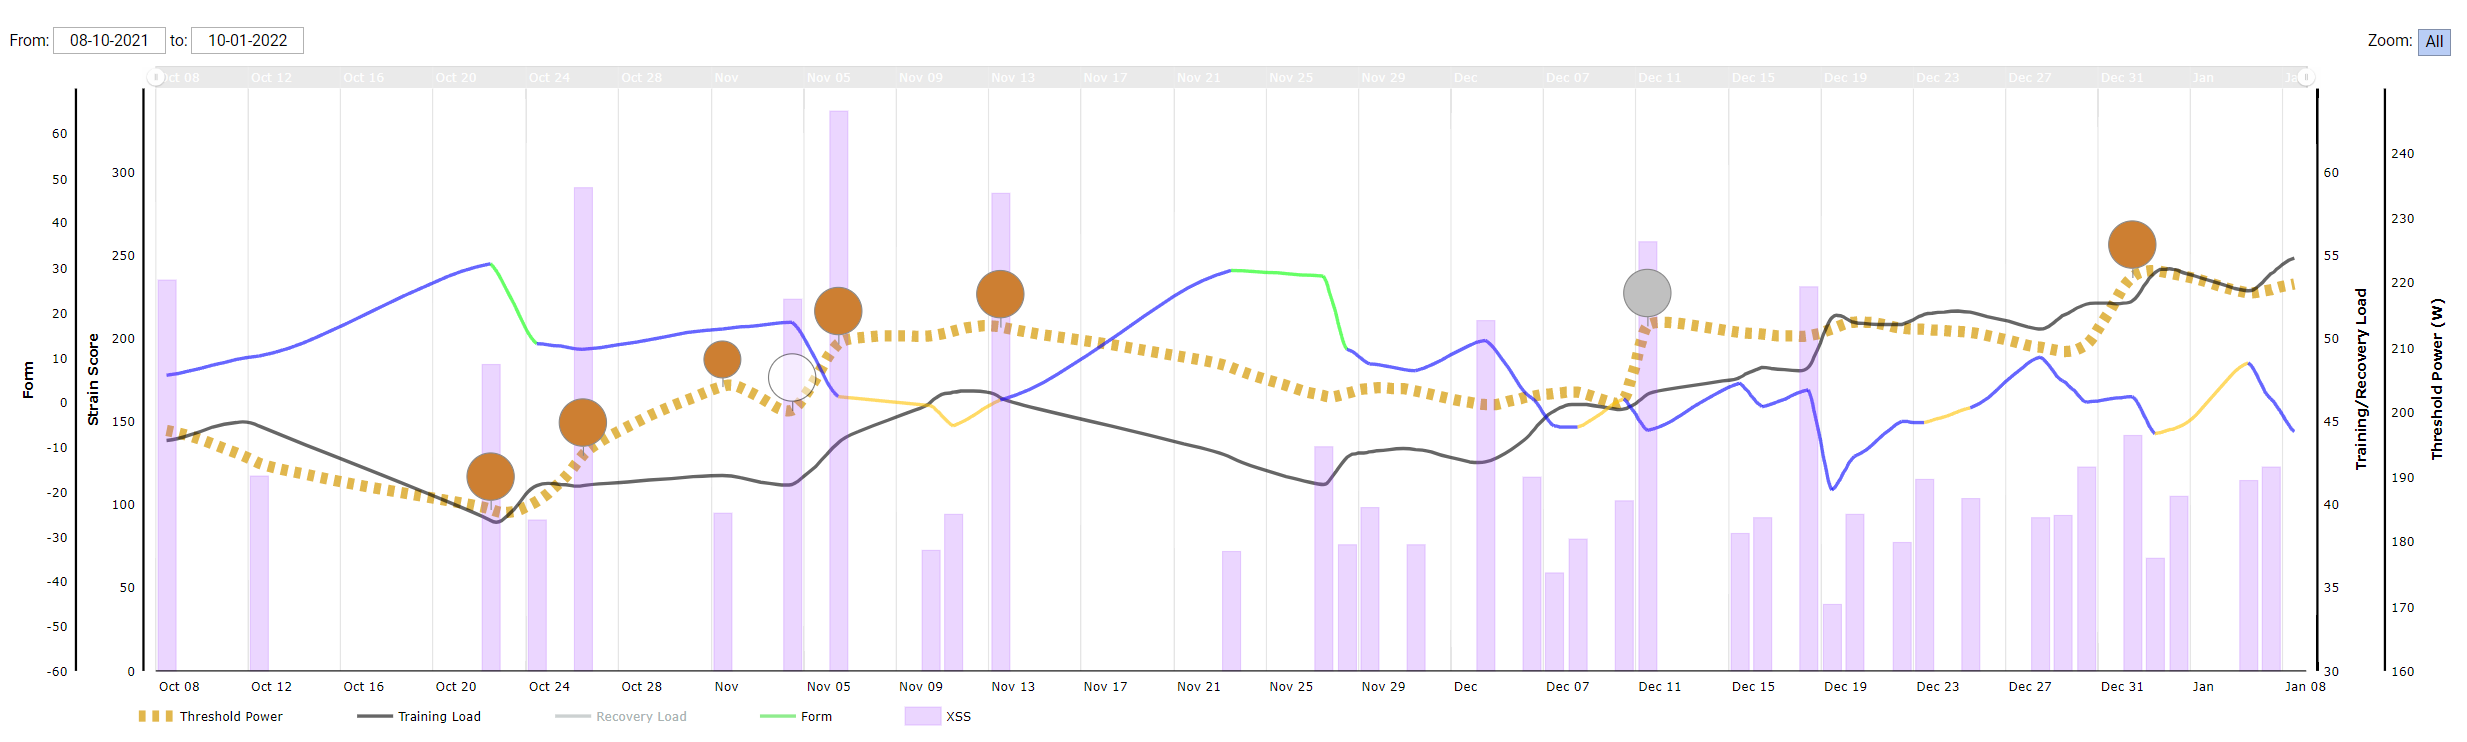
See chart:
"Are there errors in my Fitness Signature? – Xert
I don’t really have a reason to doubt my numbers. It is just that the HIE number is not meaningful to me in the sense that I have no clue what is good or what is bad. You hear about Watts all the time and you get an idea of the range you can expect. Not the same for HIE.
Edit: I just had a look at the link you provided and that helps. HIE appears just outside the range at the high end. I only started Xert 40 days ago, so I’ll see how my signature evolves. I more or less expect that my HIE will be confirmed. We’ll see.
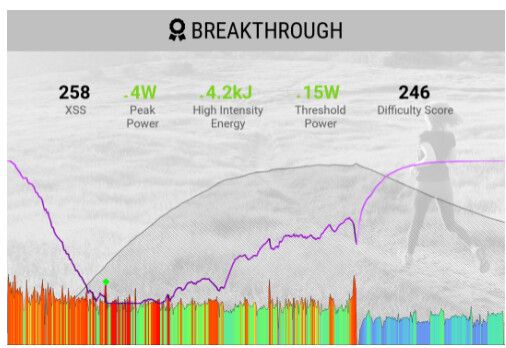
In this ride (penultimate BT, Zwift race) I got a nice improvement on both my HIE and on my TP.
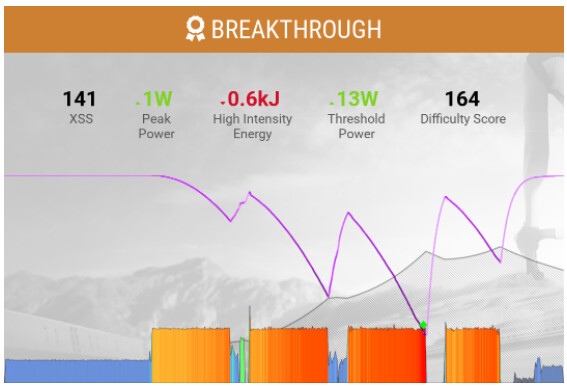
This was my last BT. Only a good TP improvement there, no change on HIE.
I think you’re hitting on something here that I struggled with as a long term Xert user. I understand, in principle, how HIE contributes, but it’s defintely the most abstract of the 3 components and I only really look at it when the other 2 seem to be off.
Having said that, after all these years with power, I think when you’re more engaged with your signature and paying attention to how it changes, and not just when you arbitrarily test (big flaw of other system IMHO), that’s a feature not a bug.
1 Like
Does your PP represent what you can do outdoors or is that an indoor figure?
The first BT chart has a difficulty score that is unlikely indicating signature isn’t dialed in yet.
See this post – Let’s See Some Recent BT’s - General - Xert Community Forum (xertonline.com)
The second BT chart looks like you’ve honed in.
Related threads –
HIE understanding - Support - Xert Community Forum (xertonline.com)
Is HIE similar enough to W for this Garmin IQ data field? - General - Xert Community Forum (xertonline.com)
Relationship between TP and HIE, and its effect on LTP - Support - Xert Community Forum (xertonline.com)
1 Like
I don’t have a powermeter (yet) on my outdoor bike. So all power data comes from my indoor smartbike. Why do you ask about the PP?
All the rides on the progress graph are from indoor rides. I started with Xert on Nov 27 and the Dec 11 BT was my first BT effort on Xert itself. So that might be the reason, but shouldn’t the imported data have been sufficient for calculating a correct signature?
Thanks for your reply and the links. I’ll certainly read them.
It is not unusual for your PP to be 150+ watts higher outdoors than indoors.
Instead of 950 you may be closer to 1100 outdoors.
That would place your HIE within the band on the scatterplot chart @TwoBigWheels linked to.
Imported data is a great start but signature calc relies on how many maximal efforts are detected and when they occurred (look for circles on your XPMC chart).
You want a ballpark baseline signature and move forward from there. I think you are on the right track.
Keep in mind all the numbers are fluid and will move up and down day-to-day based on TL (hours and intensity). Jumps occur when a maximal effort indicates calculated values are less than what you are capable of.
Regardless of the numbers you achieve during a season, there’s the element of toughness and repeatability to consider. By mid-summer at 4 stars my numbers may have maxed out, but the more I train at that level the harder I can go, the faster I can recover, and more often I can go again. YMMV ![]()
Reference –
Fitness – Power versus Repeatability – Xert (baronbiosys.com)
2 Likes