I was interested to understand more HIE, so I read some blogs about signature, many questions in forum but feels that it confused me even more and i am not sure how HIE works anymore.
I liked analogy with fuel tank, where difference between TP and PP is size of tank and MPA is like fuel gauge with HIE being fuel.
Sprinter with high PP would have big difference between PP and TP, which I undestood to be HIE. (PP-TP=HIE) But sprinters are known to have high PP, but fade out quickly and in contrast to climbers, who can go for long time with high power. Its how i understood HIE - capacity above threshold. But climber will have lower HIE than sprinter ??
And how is PD applied to that, if HIE is calculated as power above TP*seconds, or is there mathematical model, where is calculated HIE consumption rate at specific PD for each individual? I was thinking that maybe those short effort only are bounded to HIE and longer +5minutes are more depended on TP.
And because there is an inverse relationship between HIE and LTP, with higher HIE at same PP I will have a lower TP or LTP or both and vice versa.
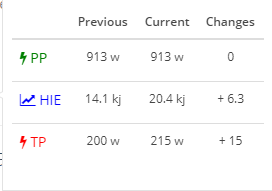
And Scott (or others) can you explain why my PP went from 913 to 921 in signature, but I did not exceed it in wokout, is it because HIE went up and TP too so PP must go up too TP+HIE=PP? And my LTP stayed the same 166,should it go down?
I might get it all wrong.
Hi there
Lots of comments, and think confusion may come from linking PP to HIE - they are different concepts. Have you seen this page on work allocation ratios? Think it will help bring some clarity, especially the first chart which shows which components are used at various intensities. Below threshold it’s all about TP no matter the intensity (in the model, maybe not in reality but that’s a different point, and potentially an area of future development for Xert when they talk about including an endurance parameter… or arguably they could replace TP with LTP) and above TP it’s about all three parameters in different proportions.
So maybe it’s fine to think of it like a fuel tank, but the size is given by the HIE parameter, not by the difference between PP and TP. Also note that HIE is measured in energy (amount of work), while the other two parameters are measured in power (work per unit time)
As to why your PP can go up even if you don’t set a new personal best, I think it can happen if you sprint when already fatigued i.e. you exceed MPA when MPA is at less than 100% / fresh levels. The final sprint in Xert breakthrough workout 3 works in this way. And it can also go up without a breakthrough (in the same way as other parameters) simply by increasing training load for that intensity by more than the decay rate… more common on no decay or slow decay settings
HIE is the amount of energy you have available ‘in the tank’ above Threshold Power.
Let’s say you had a Threshold of 250 Watts and HIE of 25 kJ:
-
at 500 Watts, you would be able to hold the effort for 25000 / (500 - 250) = 100 seconds
-
at 400 Watts, you would be able to hold the effort for 25000 / (400 - 250) = 166 seconds
-
at 300 Watts, you would be able to hold the effort for 25000 / (300 - 250) = 500 seconds
-
at 275 Watts, you would be able to hold the effort for 25000 / (275 - 250) = 1000 seconds
This isn’t exactly how Xert works as it draws down Peak Power rather than HIE, but the principle is the same and is the basis of the Power Duration Curve.
The relationship between the Power Duration Curve and HIE does not hold true for very short time scales (otherwise the amount of power you could put out for, say 5 seconds, would be very high (25000 / 5 = 5000 Watts!!!) ), or very long time scales as you can’t hold Threshold Power indefinitely.
Mike
This is the HUUUUUGE difference between Xert’s 3 parameter model and the 2-parameter (and even 3-parameter) Critical Power model. In those models, W’ is only capacity-limited, so those models would indicate that you could sprint 5000 W for 5s if your W’ is 25 kJ (or 25,000 W for 1s). However, with Xert, we know that you’re not only capacity-limited by HIE, but that capacity is also rate-limited by MPA.
Fair point Scott
I tried to simplify the answer too much: the curve doesn’t follow exactly as I have described because MPA will intersect with power output before you can use all of you HIE causing the curve to shift to the left.
Sorry if that confused matters.
Mike
When we take sprinter, he has big PP and perhaps lower TP, so I would assume that has high HIE and therefore should be able to perform longer above TP - going uphill, but its not true and in contrast to climbers, who can go for long time with high power, but has lower HIE. So how to understand HIE? I thought that its capacity above TP and I would expect that at climber.
Is it wrong, that if 2 athlets have same PP and TP would have same HIE and vice versa e.g. if ahtlete 1 has higher HIE would have lower TP or lower HIE or both. (PP-TP=HIE) is perhaps wrong or to simplify.
Scott what do you think about my question above, when my PP rised without BT. Is it because my HIE went up without and TP stayed, maybe PP is underestimated.
And on PD curve, does work alocation rate determines rates for each individual how fast is HIE used?
I am still trying to get my head around the basic concepts. If the power duration curve is in fact the method to determine one’s fitness signature then on the y axis you have power and the x you have time in logarithmic seconds. Is HIE the area under the curve? So that the higher your PP or the slower your degradation of the power curve (ie pushing the upper plateau and graph more to the right) indicates a higher HIE? If that is the case then it makes sense to me that if you maintain your PP but increase your duration a higher power your HIE will increase and be indicative of a better resistance to fatigue… is that correct? Also if you raise the whole curve this will also increase HIE and again improve your fatigue resistance but only a little in that now the power is raised for the same time duration ie say from 550 - 580 watts at the same time duration. Is this interpretation correct?
The power duration curve isn’t the method to determine one’s fitness signature. You can derive fitness signature from a power duration curve but the process would require that you use multiple activities and your fitness isn’t the same day-to-day.
Generally you’d use your fitness signature to derive your power curve (opposite of what you’re thinking).
HIE is not the area under the curve but a number that represents the shape of that curve with larger HIE values meaning the curve is wider to the right. Smaller HIE values make it more narrower.
HIE doesn’t help you resist fatigue directly but actually gives you more fatigue that you can absorb. Fatigue resistance isn’t the right thing to conceptualize. Perhaps a semantic but important difference.
HIE also is conceptually in line with burning carbs. A bigger HIE allows you to hold higher intensity longer and this essentially means you’re better a burning carbs. Burning carbs faster is equivalent to able to produce more power. They are synonymous. So while having a bigger HIE might mean ability to ride higher intensity for longer durations, it also means that you’re burning up carbs more too. This isn’t ideal for longer races or ultra-distance events. Hence having a smaller HIE in favour of a higher TP is better, even if that means lesser power at shorter durations. This is captured in LTP which is inversely proportional to HIE.
Hope this helps.
though I am thinking I sort of understand, if HIE is measured in kilowatt-seconds (kJ) then mathematically if is not the slope or the shape of the curve or the steepness of the curve. So the units of HIE confuse me. I think I understand the meaning of absorbing fatigue, put another way it is fatigue capacity, if fatigue is something that accumulates. What I am still trying to understand is that most authors discuss burning matches. And then what are matches in the XERT universe? Typically you can do so many all out efforts and each time you do you have burned a match you have tapped your reserves and ultimately you have no more to burn. In the Xertiverserse what is the measure or analogy? Xert has athlete types and we understand that different types generally have a different looking PD curve. In the article your fitness signature explained there is a series of overlaid graphs showing multiple MPA graphs indicating as time goes on your MPA degrades. The part that did not become clear from that was how they are dealt with in Xert? I always see MPA replenish to the same starting number every time, but in that article if I understood it the implication is that MPA declines depending upon certain factors? Can you please elaborate? As for High HIE is carb burning then low HIE is fat burning? and if that is the case then low HIE is sort of the diesel engine and high HIE is the F1 high revving engine. Different outputs and different fuels.
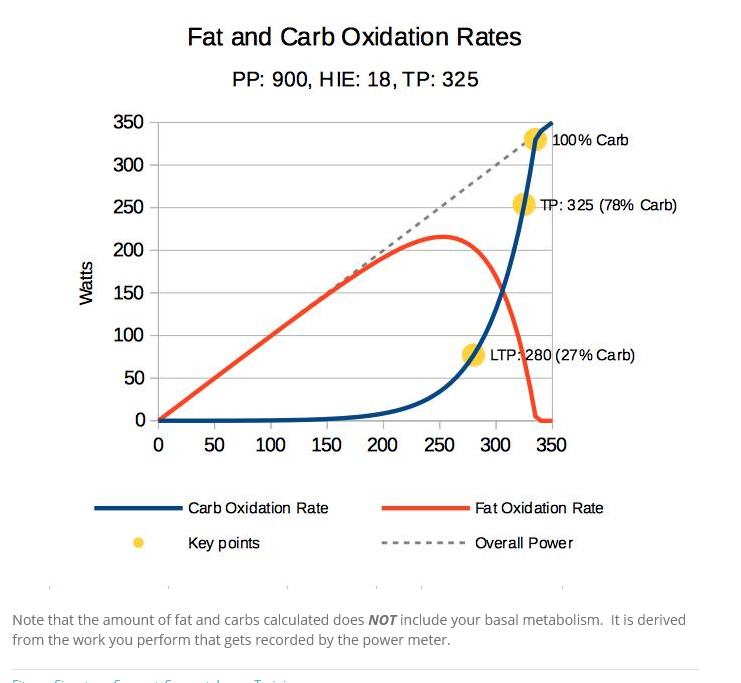
in my quest to understand this better I went to the article Track Fat and Carb Utilization. I think that graph seems to be a bit messed up? The yellow dots do not hit the line on the power points of the Y axis… The LTP dot is aligned with the 75 watt point on y and all of the dots are significantly misaligned if that is where they are supposed to be. This makes the graph difficult to interpret. For instance does the carb utilization start at TP and go linear from there? or is that supposed to be some factor above TP. Further is there any real need to use an actual wattage to understand the concept? if you had horizontal lines at LTP, and TP and then overlaid the curves so that they aligned with these then wouldn’t that work? Also how does fat and carb utilization relate to different physiology types? ie the diesel vs light weight climber vs the sprinter.
?? Pictures?
Matches is the old way of looking at things pre MPA. It’s sort of obsolete because you don’t really have a number of matches. That’s just a simplification. What you have is capacity to perform above TP. That’s measured in kJ (kilojoules) i.e. work. The more kJ you have, the longer you can hold power above TP or the more matches you have. But the number and intensity of matches you have depends on intensity, amount of recovery and your fitness signature. These affect MPA and when MPA is low, you’re essentially out of matches and you have to wait until MPA recovers. If you wait long enough (and maintain good fueling), MPA will recover fully. Many athletes can reach Peak Power later in rides and can perform just as well as at the start if they managed their carb utilization and fueling. Those that don’t will see a degradation of the fitness signature and will not be able to perform the same as at the start. This is what we’ve called “Endurance Energy” and erodes fitness signature over time. That model isn’t represented in the current interation of Xert. Some would say that to have the impact of fueling modeled would be the holy grail of performance analysis.
Hi Armando, I am not trying to be difficult, and I am appreciative of your engagement on this topic and trying to educate me. I am still a bit lost. I know when I go above TP my MPA comes down and the rate is dependent on how much over the TP you are, say 200% eats up MPA really fast and 110% eats it up slowly. I know this is the secret sauce in WERT but there is a rate constant or some aspect of TP that defines that rate of decline. I don’t expect you to say what that is but I suspect that mathematically related to HIE? PP defines the beginning or max MPA you have, since that is also clear from the data on my fitness page. What troubles me is that I can go for a ride and be absolutely trashed when I get done but my MPA just blips off the top line. That is why I am trying to understand this. I need to get it into my head to understand how I can improve my ability to do that same ride without being trashed. What aspects of the signature is the key and how to get there. That is what I use XERT for not to race but to improve my enjoyment on tough rides or said another way how to make tough rides the same RPE just faster… or the same speed/ avg power just RPE is easier.
To understand this chart, the red line is the fat contribution to power and blue is carbohydrate. As power increases (along X-axis), more carbs contribute to the power. At LTP, 27% of the power comes from carbs (and 73% comes from Fat). The shape of those curves depend on your signature.
that part I got, the part that was ambiguous was where the TP and LTP yellow dots are relative to the Y axis values or are the yellow dot just the points for the LTP TP regardless of the watt value that aligns with them?..

I do not understand it myself but the values align on the x-axis.
Looking at it some more the y-axis seem to be fat and carbs values (those are the curves) and the x-axis is power output, so both curves added together.
I think you are right they meant to have the watts on the x axis and the Y was supposed to be nutrient usage in some arbitrary units.But,note the Y axis specifically says Watts, not g or any other measure of nutrient usage… so I still ask why the two are oddly aligned.
Both axis are Watts, one is the usage from carbs and fats separately (y) the other is both combined and thus the whole power output (TP and LTP marked). I think.
I think I got it now 
It reads like this: You look at the power output that you are interested in on the x-axis, say 150W and you see that you would use only fats then. At 200W there is a little bit of carbs contribution, at 300W both are about half of it (where the red and blue curves intersect) after that fat falls down fast and carb climbs fast and at about 340W everything comes from carbs.