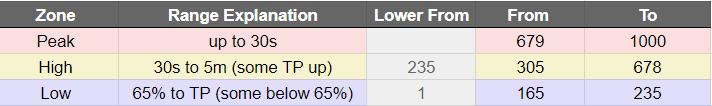
@ManofSteele where do I find the watts/TP % ranges for low/high/peak power zones used in the planner and to compare planned v completed training for the day?
I ask becasue today I climbed the Alp on Zwift, 55 minutes with avg of 95% TP, so hard work. This only earned me 1.6 high XSS the rest is ‘low’, so an hour of almost TP effort is 99% low intensity? Plus before the ride I was showing as tired, after killing myself for an hour I’m now showing as ‘fresh’ in exert. This low/high/peak XSS seems to be an intengral part of the Forecast AI, but I can’t see where these zones are defined. At the moment, the way I see it is that 10% TP and 95% TP are both ‘low’ XSS scoring, but they work very different energy systems.
Today I thought that my climb would have accumulated a lot of ‘high’ XSS, however during the ride I cannot see this, and after the ride it just created more confusion. By which time I’d killed myself climbing, but not met my ‘high XSS’ for the day.
I’ve come back to test Forecst AI because I want to love and use Xert, but I’m just getting confused and slightly demoralized.
Below TP is endurance in Xert.
“Hard” endurance perhaps (tempo/SS) but endurance level nonetheless.
If you want to accumulate high/peak points some portion of your activity needs to include time above TP at the appropriate strain level. No different than MPA line not moving if all strain is below TP. Sweet Spot, Threshold and Polarized Training … By the Numbers – Xert (baronbiosys.com)
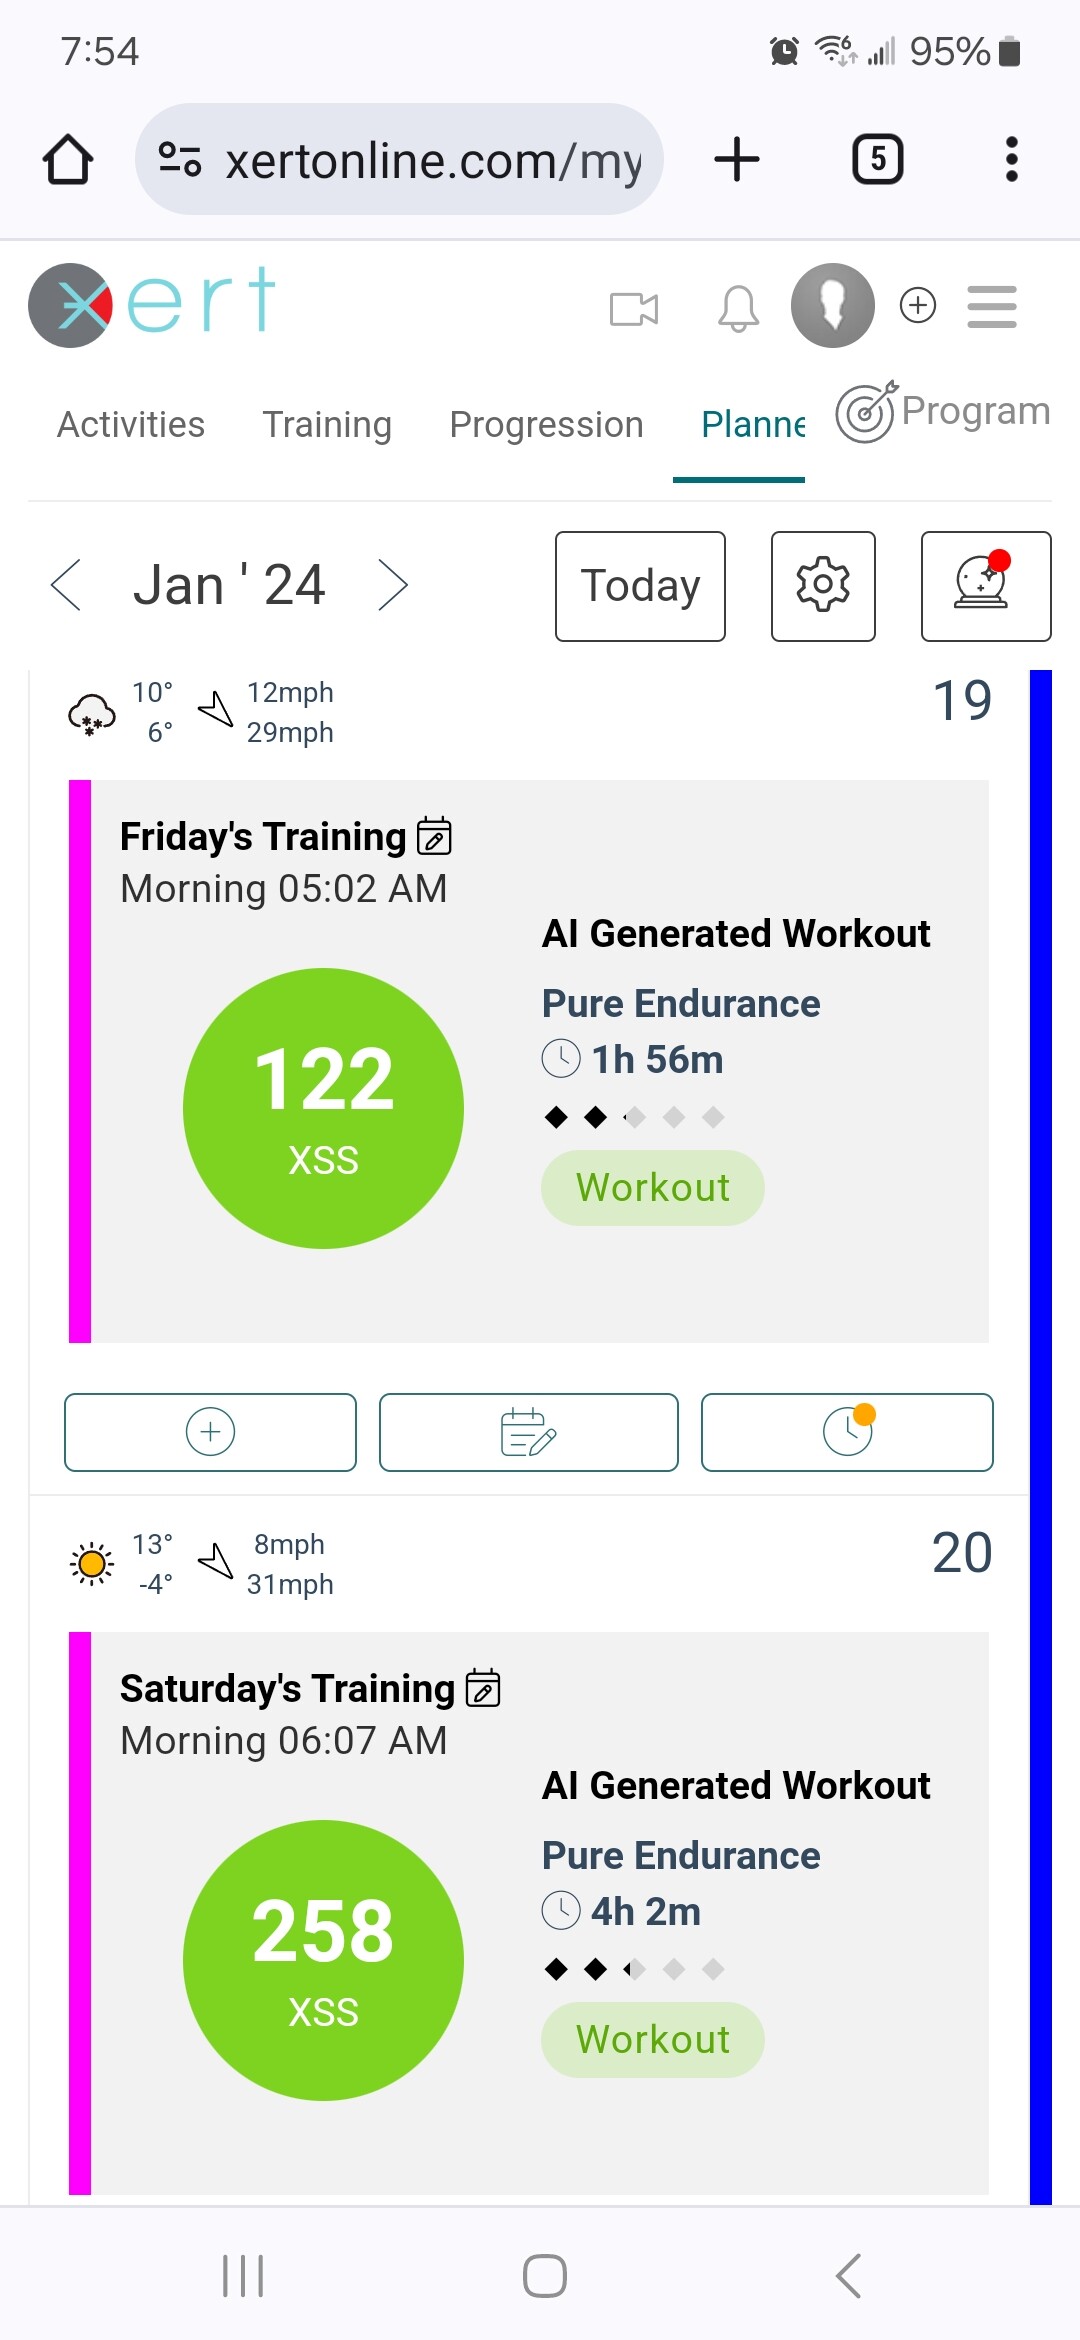
All of the workouts now include the XSS ratios. It’s very easy to see where high/peak points accumulate by viewing the thumbnail charts and comparing the ratio.
@ridgerider2 Thanks, I now understand that anything under TP is classed as ‘low’. High and peak, I still don’t quite understand how to differentiate between. I want to know this, not for selecting Xert workouts but for free rides I do. Many of the Xert proposed workouts are too hard, crazy hard, or I’m crazy weak.
At the minute I have hit my low XSS target,for the day but somehow need to find 48 XSS of high, and 9 XSS of peak, which from what I’m seeing is crazy, crazy difficult to achieve. Particularly as I don’t know how quickly these XSS are accumulated at which power outputs.
I didn’t follow the workout guidelines. I had a zwift ride to lead up Alpe du Zwift, so 53 mins at 95% TP… I’m trying to weave Xert training into free rides at least 3 days per week.
The presribed workout was with targets of 150% TP, offered workout was 15x 150% TP intervals of 90 second. Once of those crazy workouts that Xert thinks I could do but I have no chance.
But when I do such a ‘free ride’, it’d be good to know what power I need to be at to accumulate low/high/peak XSS… even better if I could see it real time.
If you don’t intend to follow the recommendations there isn’t a dire need to match the XSS targets for the day. With a XATA guided blank calendar (120 Day Program, Continuous, or Challenge) you primarily want to monitor the Training Pacer and stay within the 11am-1pm position week to week.
Matching targets comes into play more with an FAI plan.
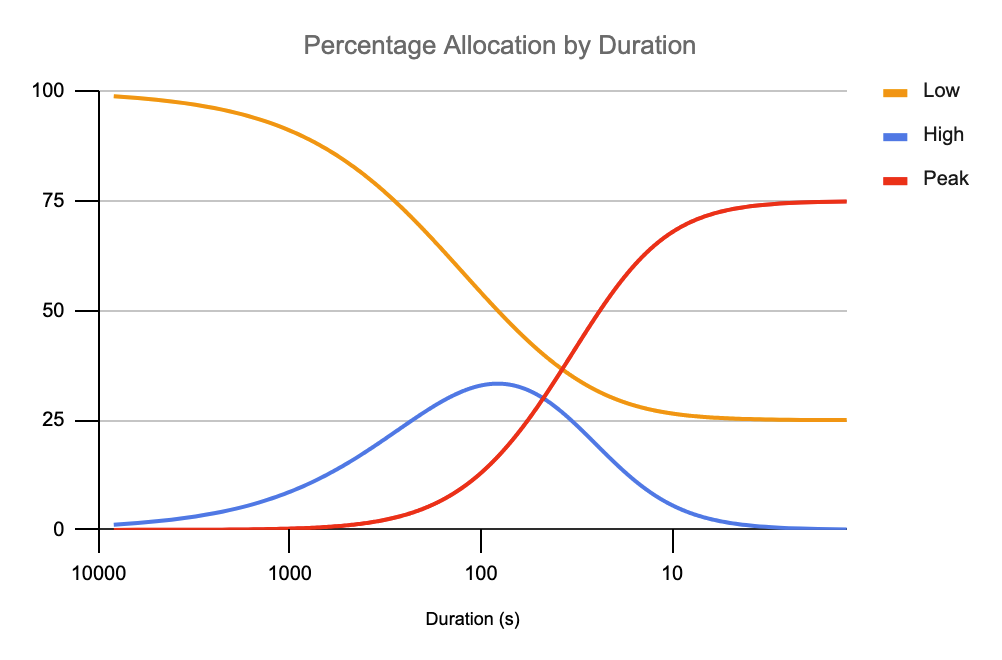
This is over simplifying it but you can consider sprints as peak efforts (red spike intevals) and longer intervals above TP but below peak watts (yellow/orange intervals) as accumulating high strain.
In reality any effort about TP (especially outdoors) includes a bit of all three strain levels (low, high, peak). However, the “focus” of the strain fills one bucket more than the other.
For free rides one thing you can do beforehand is run Autogen, view details, and consider performing similar intervals during your ride as terrain and traffic allow. Doesn’t have to be exact but you want to roughly hit the target watts (or higher) at similar durations. Doesn’t have to be the entire ride, but some portion of the route where you can concentrate on filling the high/peak buckets while the rest of the ride is low intensity.
You can also take a look at recommended outdoor activities you’ve done in the past that match today’s target. For example, if Mixed GC Specialist is today’s target, is there a route on file which was rated as such in the past? Consider riding that route again or remember what the effort entailed and try to duplicate that.
Thanks, useful stuff. I still feel the low/high/peak representation, guidance and explanations needs some simplification going forward.
I tried autogen it failed today, first time it has failed for me, until now it has been very useful.
I like the idea that it tells you where to focus, shame it doesn’t tell you what those zones mean, or give tools to monitor them during a ride - so perhaps an enhancement requiest.
In the past Xert has had too steep a learning curve for the masses, I feel like Forecast AI could overcome that if the info is presented well… probably why I am asking my questions. If I’m a tad confused and speaking up, then there will be more like me keeping quiet or leaving in silence.
Not sure if it is directly related with the topic but what does it mean if the forecast workout has a pink bar instead of the normal blue yellow and red ?
@eeney I can understand the confusion. I do want to clarify that just because a ride doesn’t have lots of ‘high’ strain, it still can be a hard ride! One of my favourite VO2max workouts are the SMART - Closer series of workouts with the curved XSSR intervals. These workouts keep my HR significantly elevated, but don’t actually rack up a lot of ‘high’ strain, despite feeling pretty tough.
Technically it’s the same energy system - both are steady state, so both have to be aerobically sustainable. However, I could see an argument for there being anaerobic glycolysis in the ‘sweet-spot’ range. Modeling efforts in the ‘near-threshold’ region is an area that I think could likely be greatly improved in the Xert 2.0 model.
However, if you think about the main 3 energy systems, then I think this will make more sense…
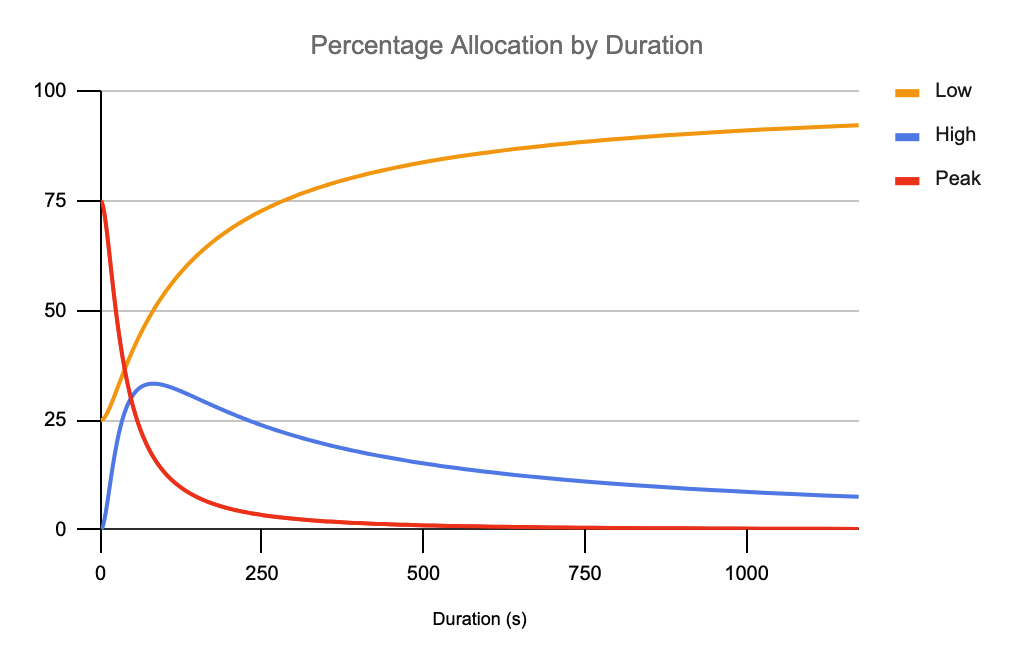
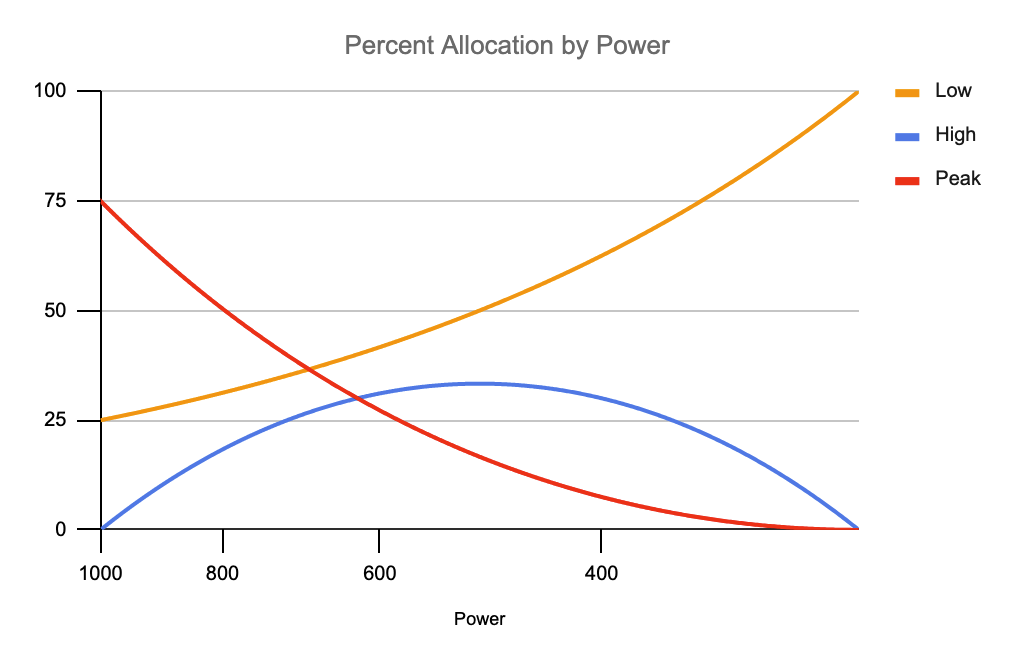
Phosphagen System (ATP-PCr System): - e.g. Peak XSS: This system provides immediate and short bursts of energy. This is the main energy system for ~1s to ~30s power.
Glycolytic System (Anaerobic Lactic System)- e.g. High XSS: This system kicks in when the demands for energy exceed what the phosphagen system can provide. It involves the breakdown of stored glycogen (carbohydrates) into glucose, which is then converted into ATP through a process called glycolysis. This is the main energy system for ~30s to ~3 min power system (though it still contributes to all efforts above threshold in diminishing amounts)
Oxidative System (Aerobic System) - e.g. Low XSS: The oxidative system is the primary energy system for longer, sustained efforts, such as endurance cycling. It relies on the aerobic metabolism of carbohydrates and fats, utilizing oxygen to generate ATP. This is the main energy system for 5+ min power.
@ManofSteele Thanks for those explanations. Helps explain the theory behind it. Can we go back to my question about how to guage at what power range and ‘how much’ strain in a ride has been done at low/high/peak?
I’m really struggling with this, because the new FAI uses low/high/peak XSS to gauge how closely you have met your training goals for the day, however. I cannot find what the power ranges are for these three zones and I cannot see how to view the XSS by low/high/peak in the Xert app, neither as Garmin data fields/ap or in the Android app (I use Garmin head unit outdoors and Xert on Android to view my indoor (Zwift) sessions).
I like the idea that rather than just the guage we now have low/high/peak XSS targets for the day, but without knowing the power ranges and been able to see the XSS real time then it makes it very hard to plan your own workouts/rides and/or know when to stop riding. Note that I don’t always use Xert workouts, I like to view the workout requirements, then do zwift group rides, workouts or races that meet the Xert prescribed daily training targes.
Please let me know where we find the power ranges, or if this is a ‘future enhancement’ which I can happily accept.
I’m sure future updates will expose the XSS ratio everywhere (XO server pages and EBC apps).
In the meantime, you can view the ratio for ALL of your past activities.
For example, you asked how much strain would is required to hit 46 High and 9 Low XSS on a free ride/workout. For comparison and insight do this.
Enable Specificity, Focus, Low, High, and Peak XSS using Edit Columns.
You likely have to disable some columns that don’t matter at the moment such as current Athlete Type and other entries. You want the five columns noted to fit on the right side of the page.
Now sort the table by High XSS descending by clicking on the column header.
Scroll down the list until you locate entries around 46 High XSS, any Peak value. That will give you an idea what type of rides/workouts you rode in the past to achieve those numbers. You can click on the Name entry to view details and a map if outdoors.
This is also why I asked what the description of the Forecast activity was on the Planner such as Mixed Rouleur or Pure GC Specialist.
The analysis details will show you the range of watts you hit on those rides/workouts along with MPA drawdown graph and a difficulty rating (diamond count).
Whatever your target XSS ratios are in the future, this table view provides insight on the routes and workouts to consider to achieve those values. Past outdoors rides will also be listed under Outdoor recommendations when you Choose Training.
IOW you have been free riding to these target XSS ratios all along at the Specificity and Focus Duration points noted whether you knew it or not.
No doubt it will be easier to track ratio target compliance when added to EBC or as a Garmin Connect IQ field, but this table view gives you a pretty good idea what’s required. You aren’t flying blind.
@eeney what I do is I create a (temporary) manual workout and select some interval values above TP and see how much high strain a specific interval will deliver. This way I have a little idea on how to achieve those values in a planned ride. If you play with recovery, you can see that the values can change.
I think it is important to not view L/H/P as power zones. It is total different mindset, but I like something new
Probably not since it’ll just confuse people. The more you show, they more users think the need to understand to use the product and then more they abandon since they can’t make sense of it. Better if we just give you simple targets to follow and let all the underlying algorithms figure it out for you.
Hhhhmmm, fairplay. My only comment, and perhaps it’s just me. But if I"m out on a free ride, or doing zwift group rides, etc for training. Then I’d like to know what my current XSS is in relation to the low/high/peak targets for the day, and if I want to increase one of them, then what types of efforts do I need to do to acheive achieve XSS in each of low/high/peak.
If you give me targets, but on a free ride I do not know you to ride to contribute to the specific targets, or if I have do planned Xert created workouts in order to contribute accurately to specific XSS targets, then I think it’s taking away some of the beauty of Xert where you can easily integrate free rides and workouts on the one intelligent platform.
Example, yesterday I had 121 low XSS to achieve. In an outdoor ride I acheived the XSS overall target, but 12% was in high/peak, and I was therefore below my ‘low XSS’ target. If I had seen this on the ride, then I could have just done another 10 minutes tempo to hit the low XSS daily target.
Again, this may be me, but you give me great targets like this to manage my daily training loads and I will want to stick to them quite closely.
This may just be me, perhaps I’m just too caught up on targets