All power values below TP contribute the same amount to XLSS?

If I interpret this graph correctly, all power values below TP contribute the same amount of XLSS. This does not make sense to me. Obviously, riding at 95% or 70% of your LT, will result in different amounts of strain and adaptation.

For example, these 2 workouts of 2 hours at Tempo 21x2min at 85% and Threshold 21x2min at 95% both result in exactly the same amount 128 XSS, while abviously the second one will be harder and take longer to recover from. Granted, the rest intervals of the second one are at a lower wattage, but I do not believe the difference between 50% and 60% of TP will be a meaningful difference.

1 Like

The graph only shows that 100% of the contributions will be classified as low XSS as long as you remain below TP. However, the rate at which you accumulate XSS is higher at 100% of TP than at 50% of TP.

Xert assumes that 100 low-XSS training is always 100 low-XSS that must be recovered from, regardless of intensity or how recovery-efficient the session actually is. The argument for training below LT1/VT1 is precisely that it is more recovery-efficient than tempo training, even if both are classified as low XSS.

1 Like

I think what you mean to say is that all power values below TP contribute only to XLSS. As @hpbieker points out, they don’t all contribute the same amount. Intensities closer to TP contribute more.

One could make an argument that intensities below TP should be partially assigned to XHSS. In fact, this is something we are exploring and currently evaluating for Xert 2.0 that’s in development. Here’s an example of how the differences are seen:

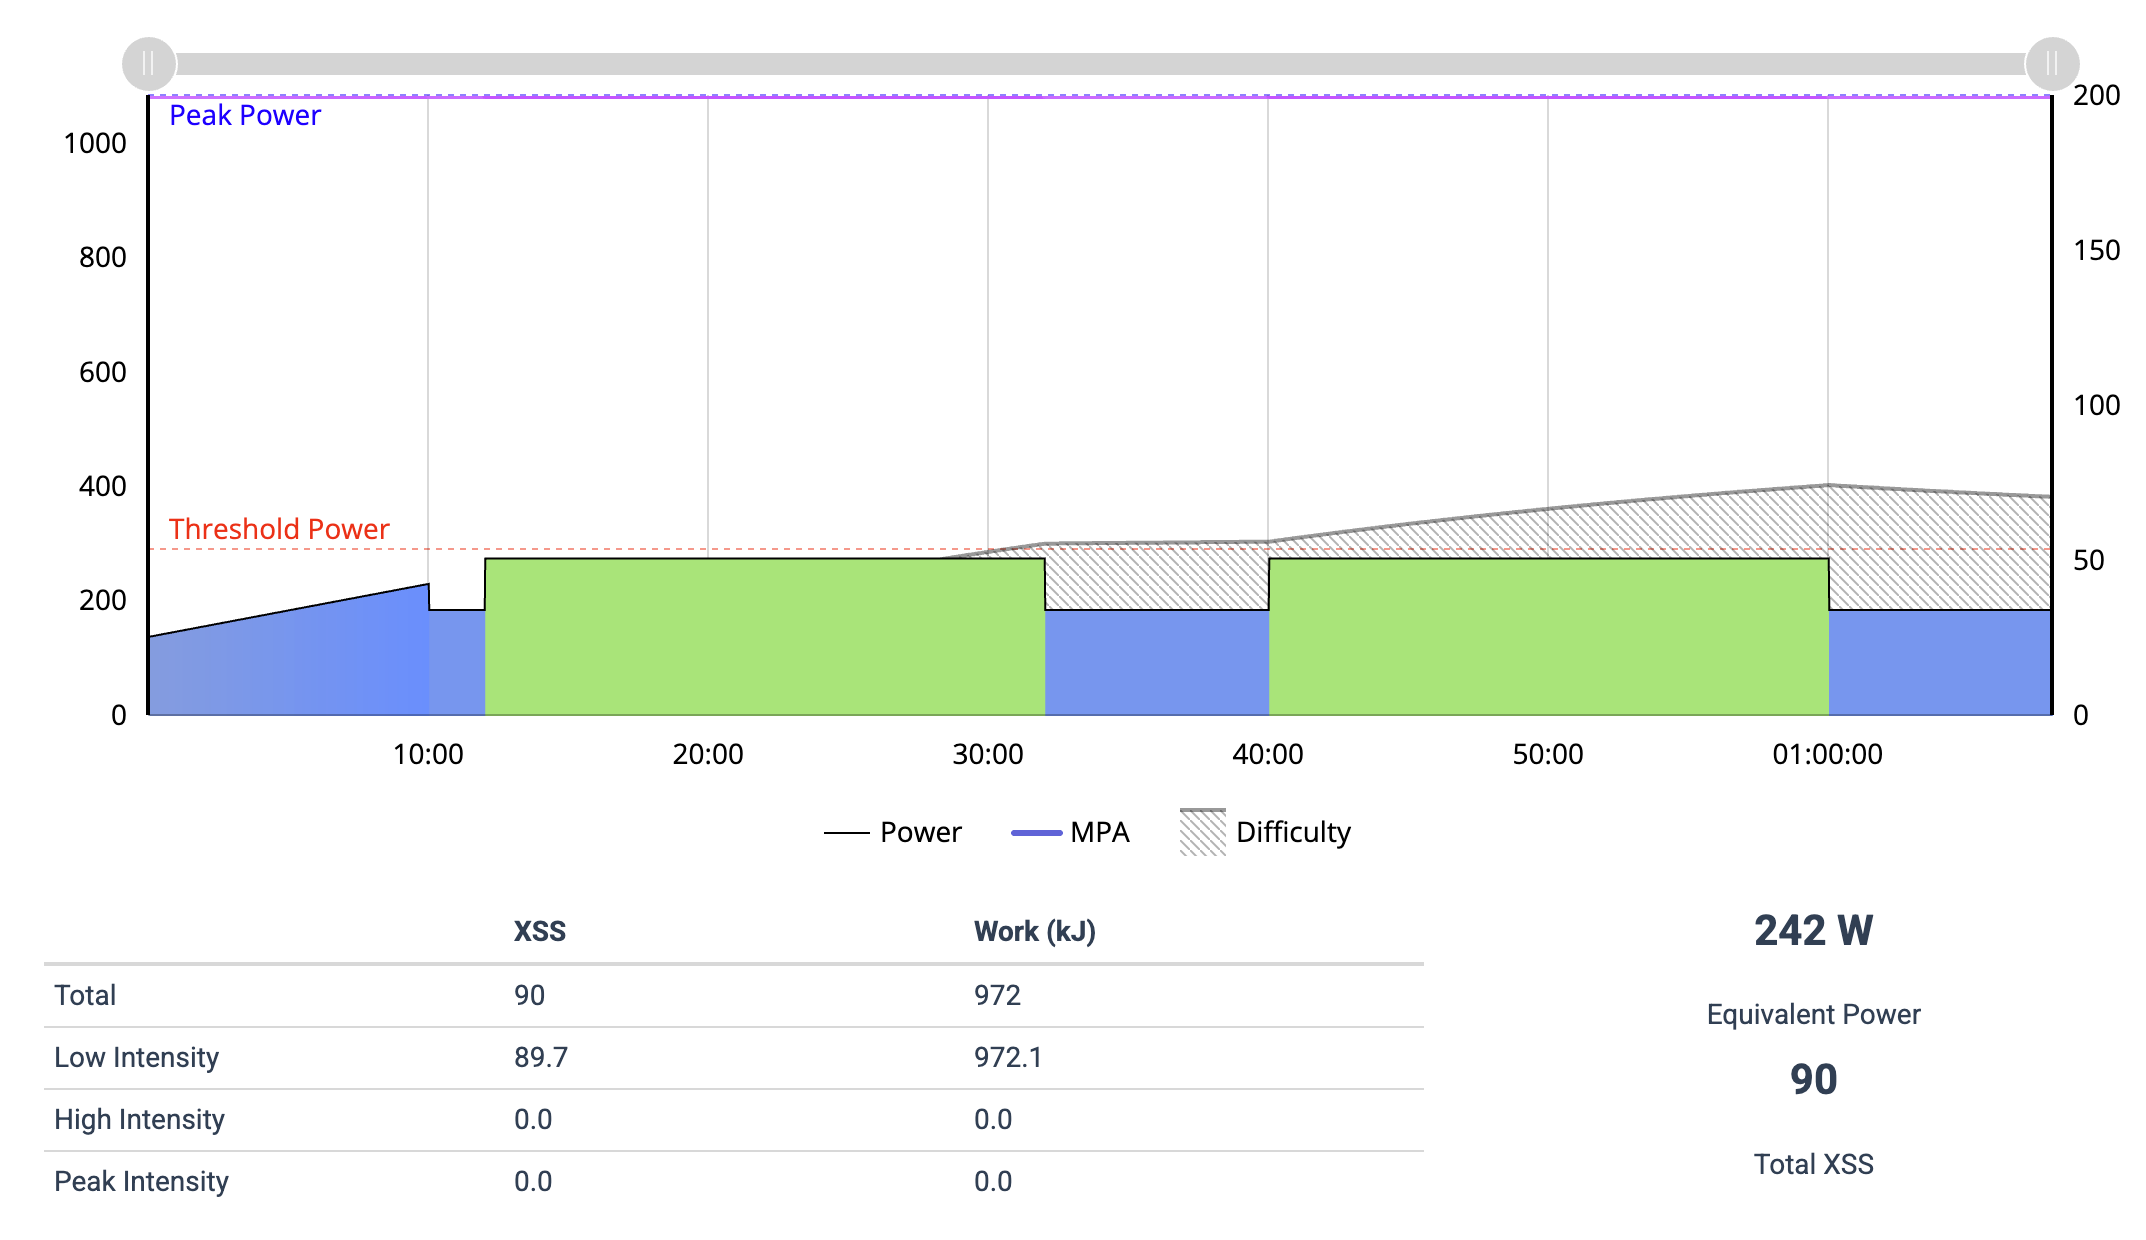
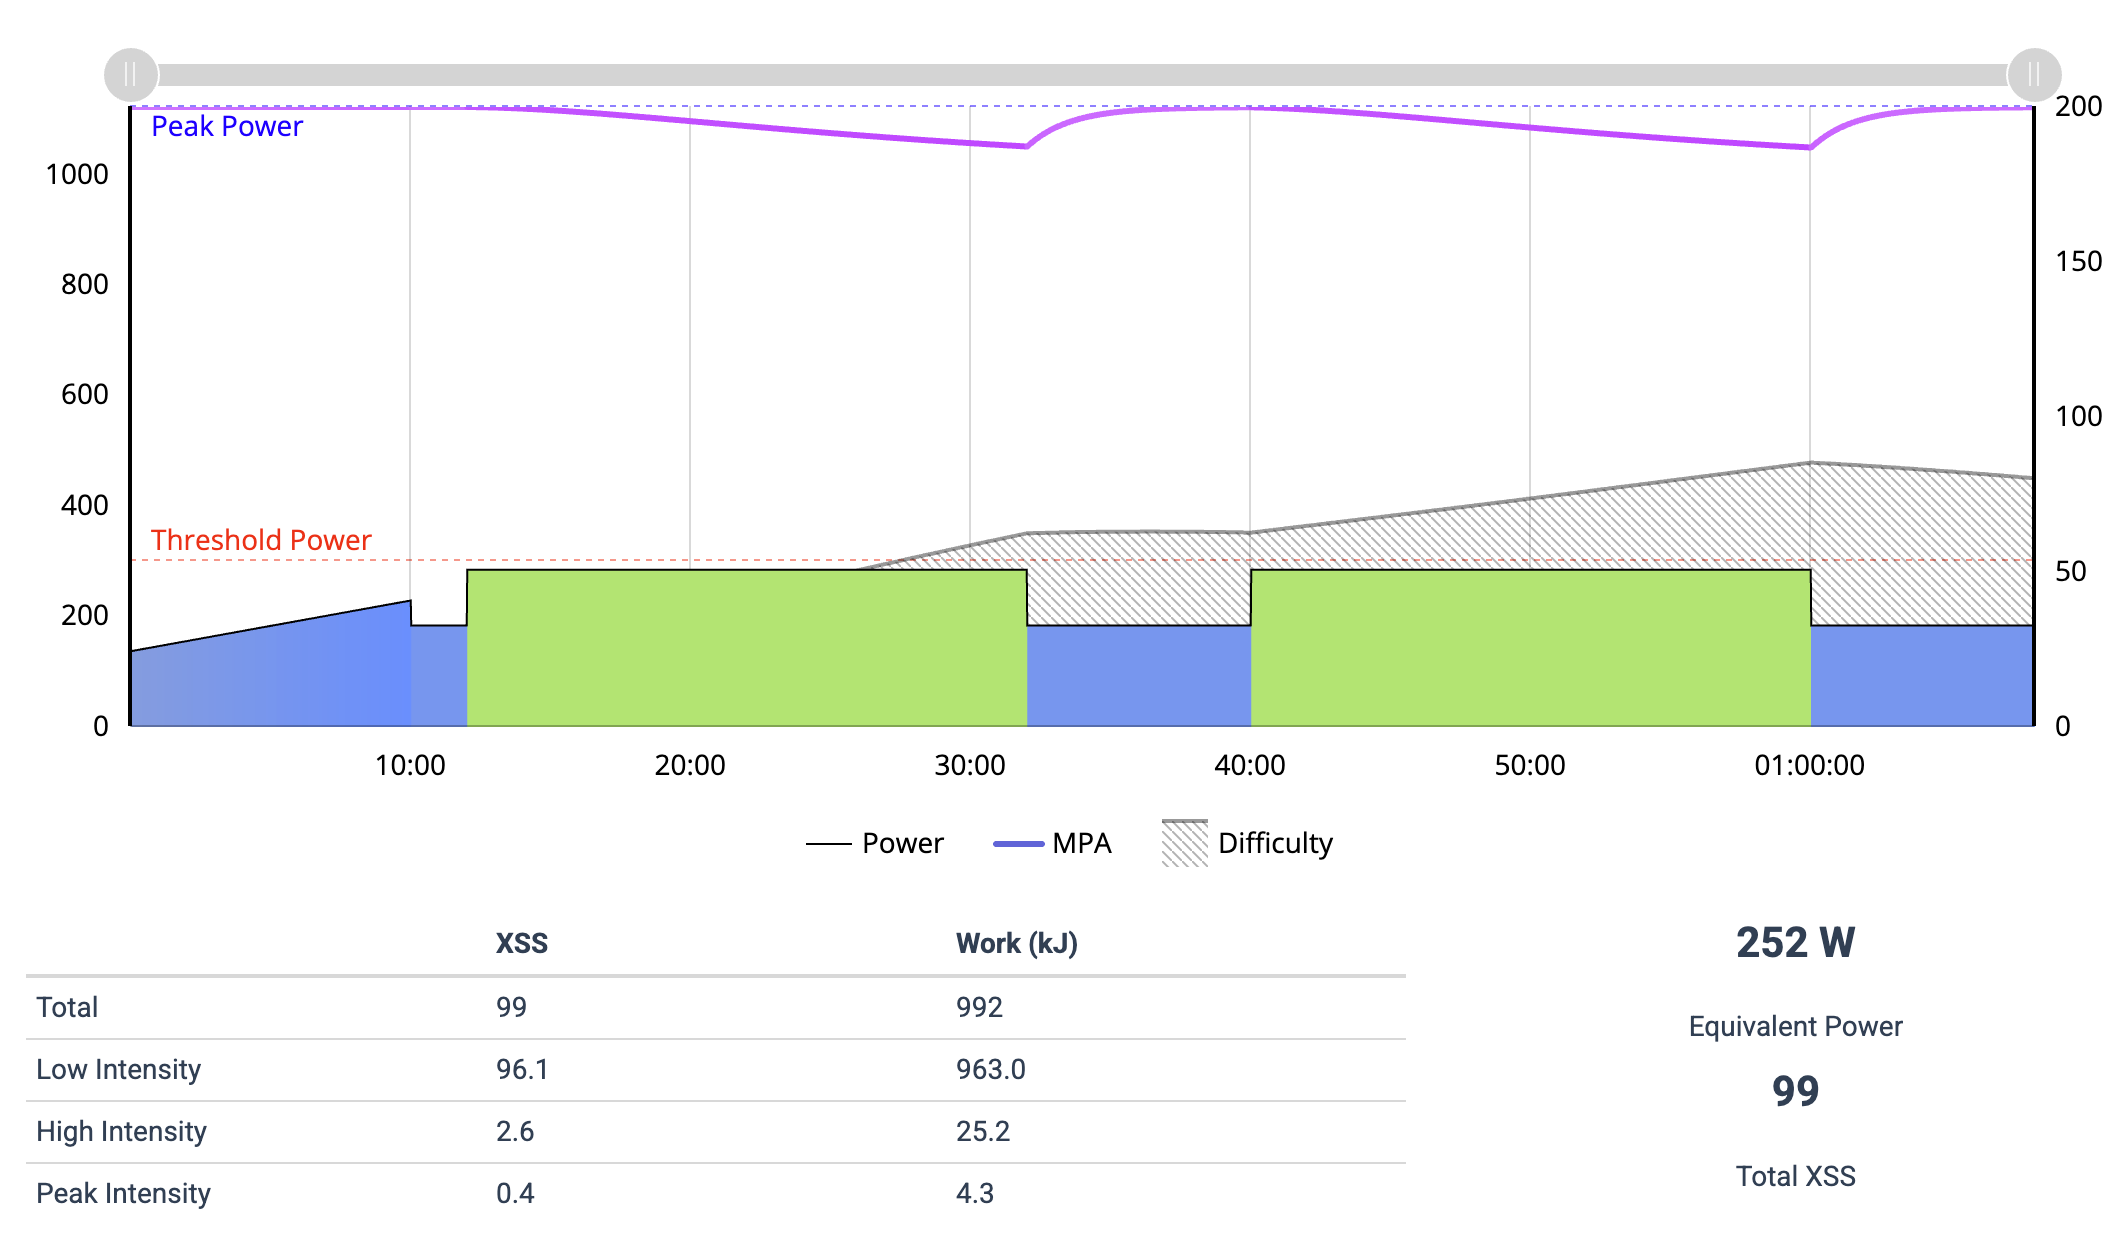
Let’s evaluate a 2x20 sweet spot workout at 95% of TP. This is upper-upper range for “sweet spot” but makes a good comparison:

What you’ll notice first most likely is that MPA comes down at 95% of TP in 2.0. That’s new and we think this will improve the MPA model overall. This drop in MPA is due to XHSS being accumulated below TP. Note the differences in XHSS (and XPSS too) between the two workouts. You’ll also notice the differences in XEP and Total XSS. You can also visually gauge the difference in difficulty scores. 2.0 will better reflect the recovery demands since it will make your training status more likely to be yellow after doing this workout.

This you could say is a material difference between 1.0 and 2.0. However, this workout is atypical and unless you plan on doing this type of workout as your main go-to workout during a plan, the accumulation of differences between 1.0 and 2.0 are not likely to manifest into anything materially different. If you were to spend all of your time doing this type of workout for all of your training, you would likely adjust recovery demands to ensure you get proper recovery in the current system.

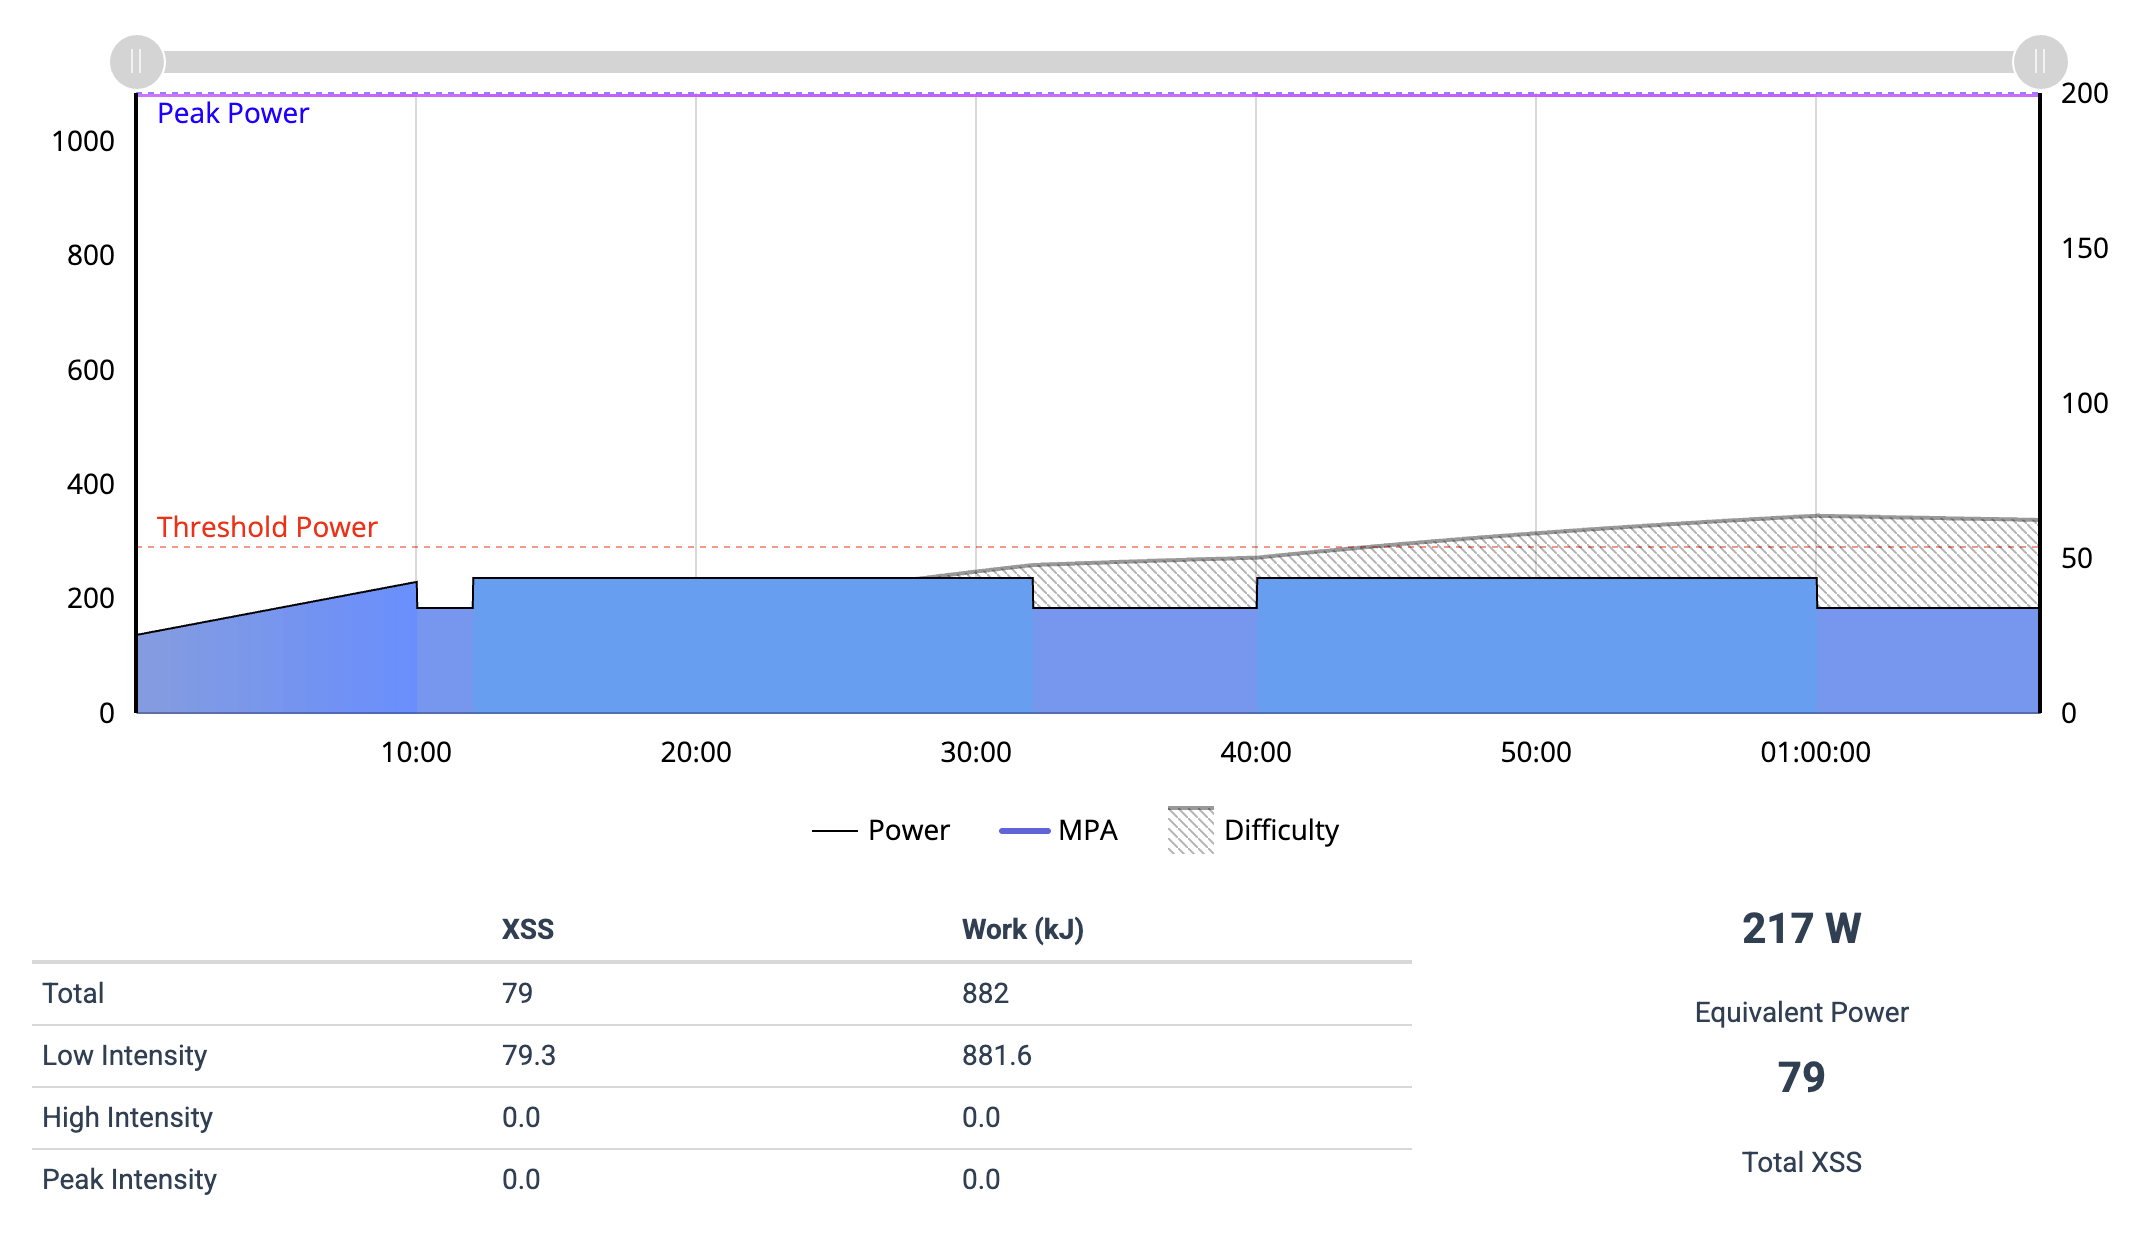
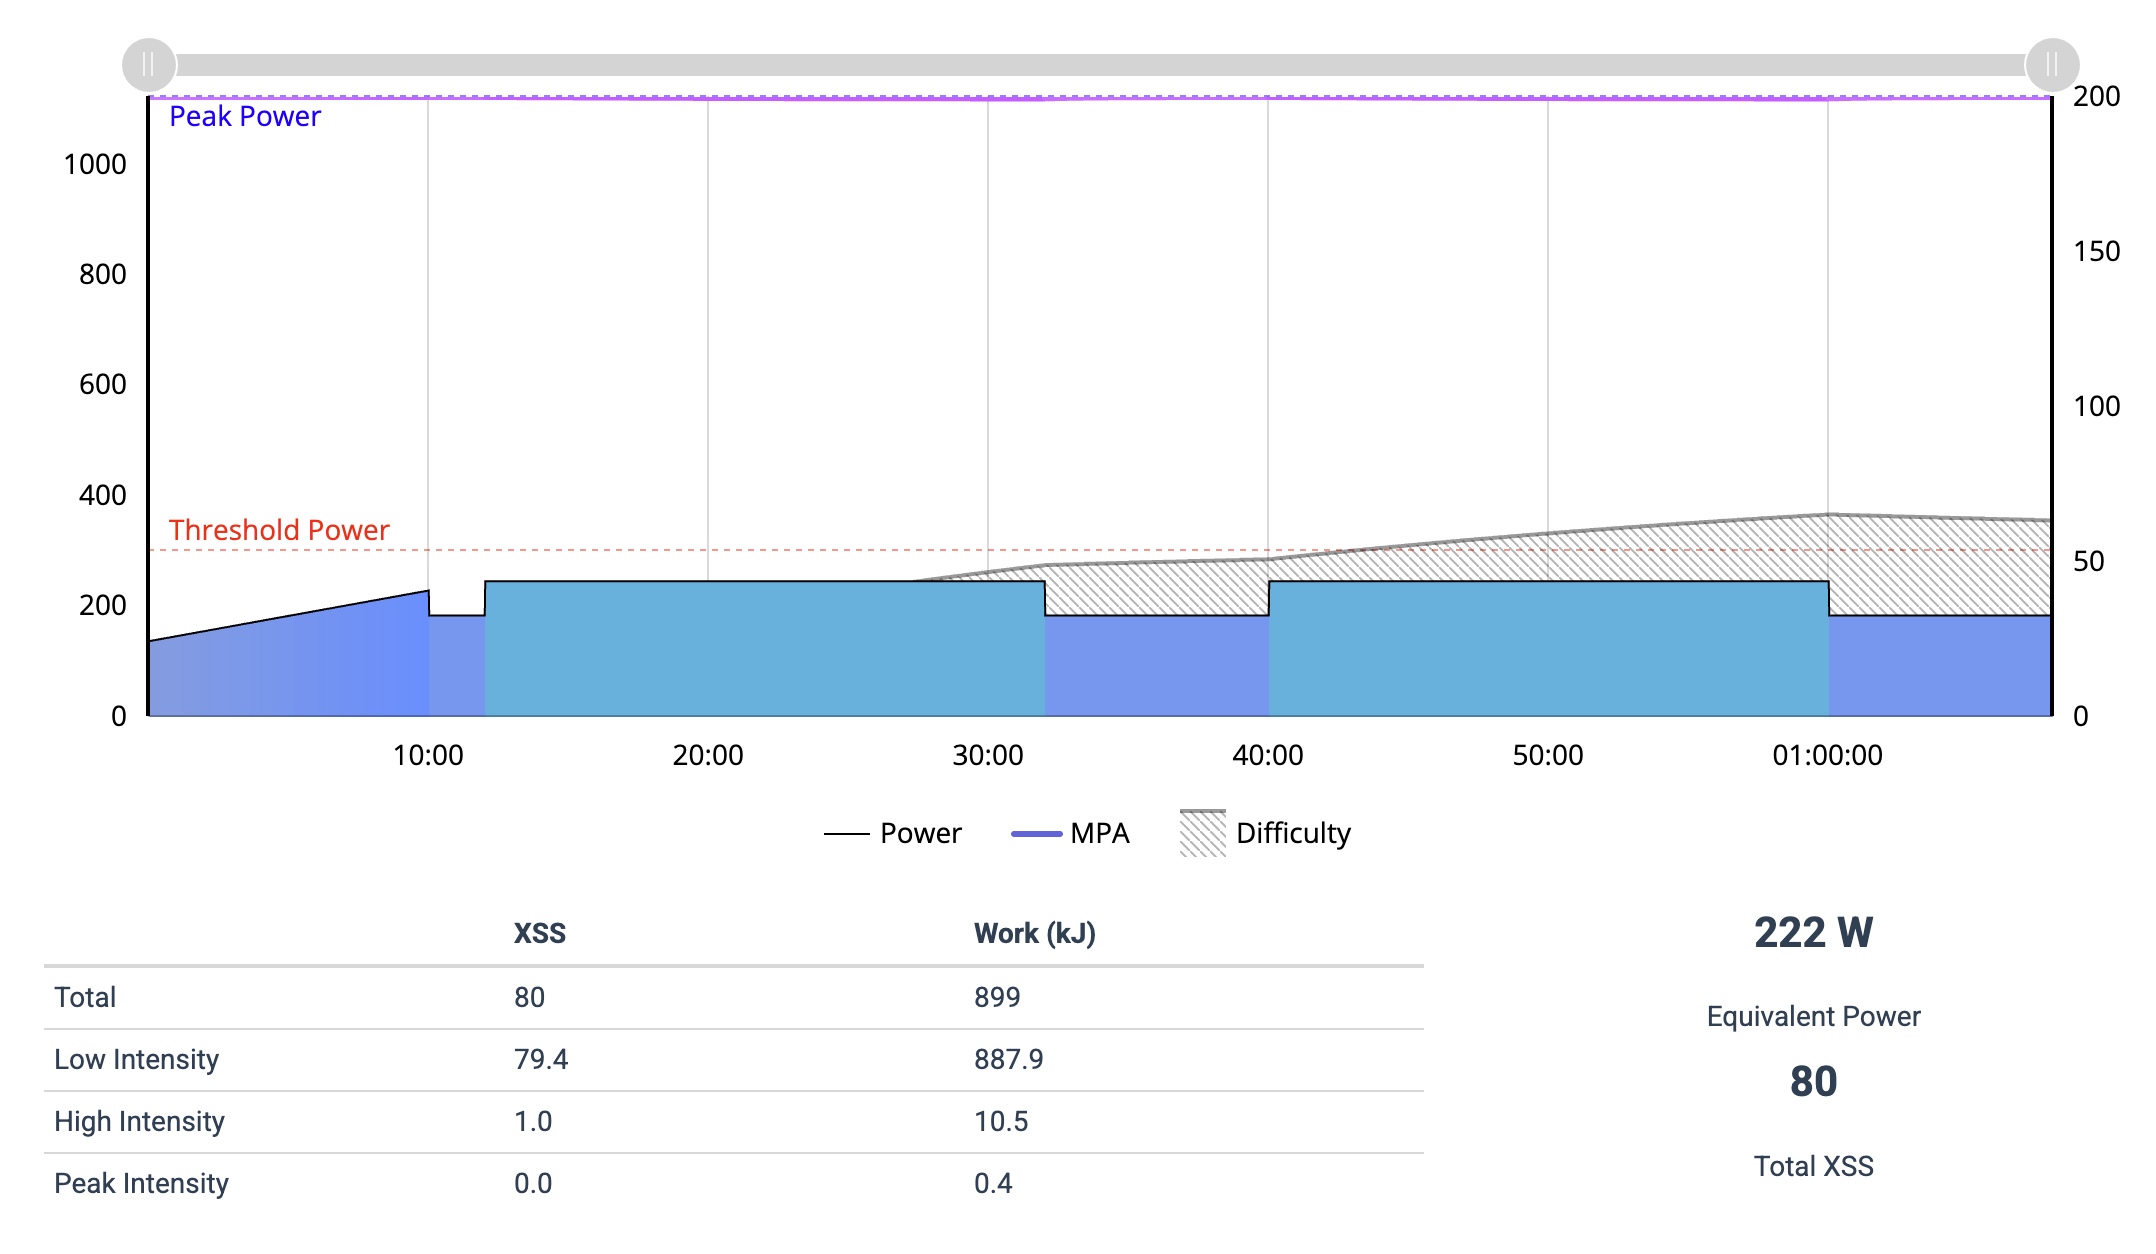
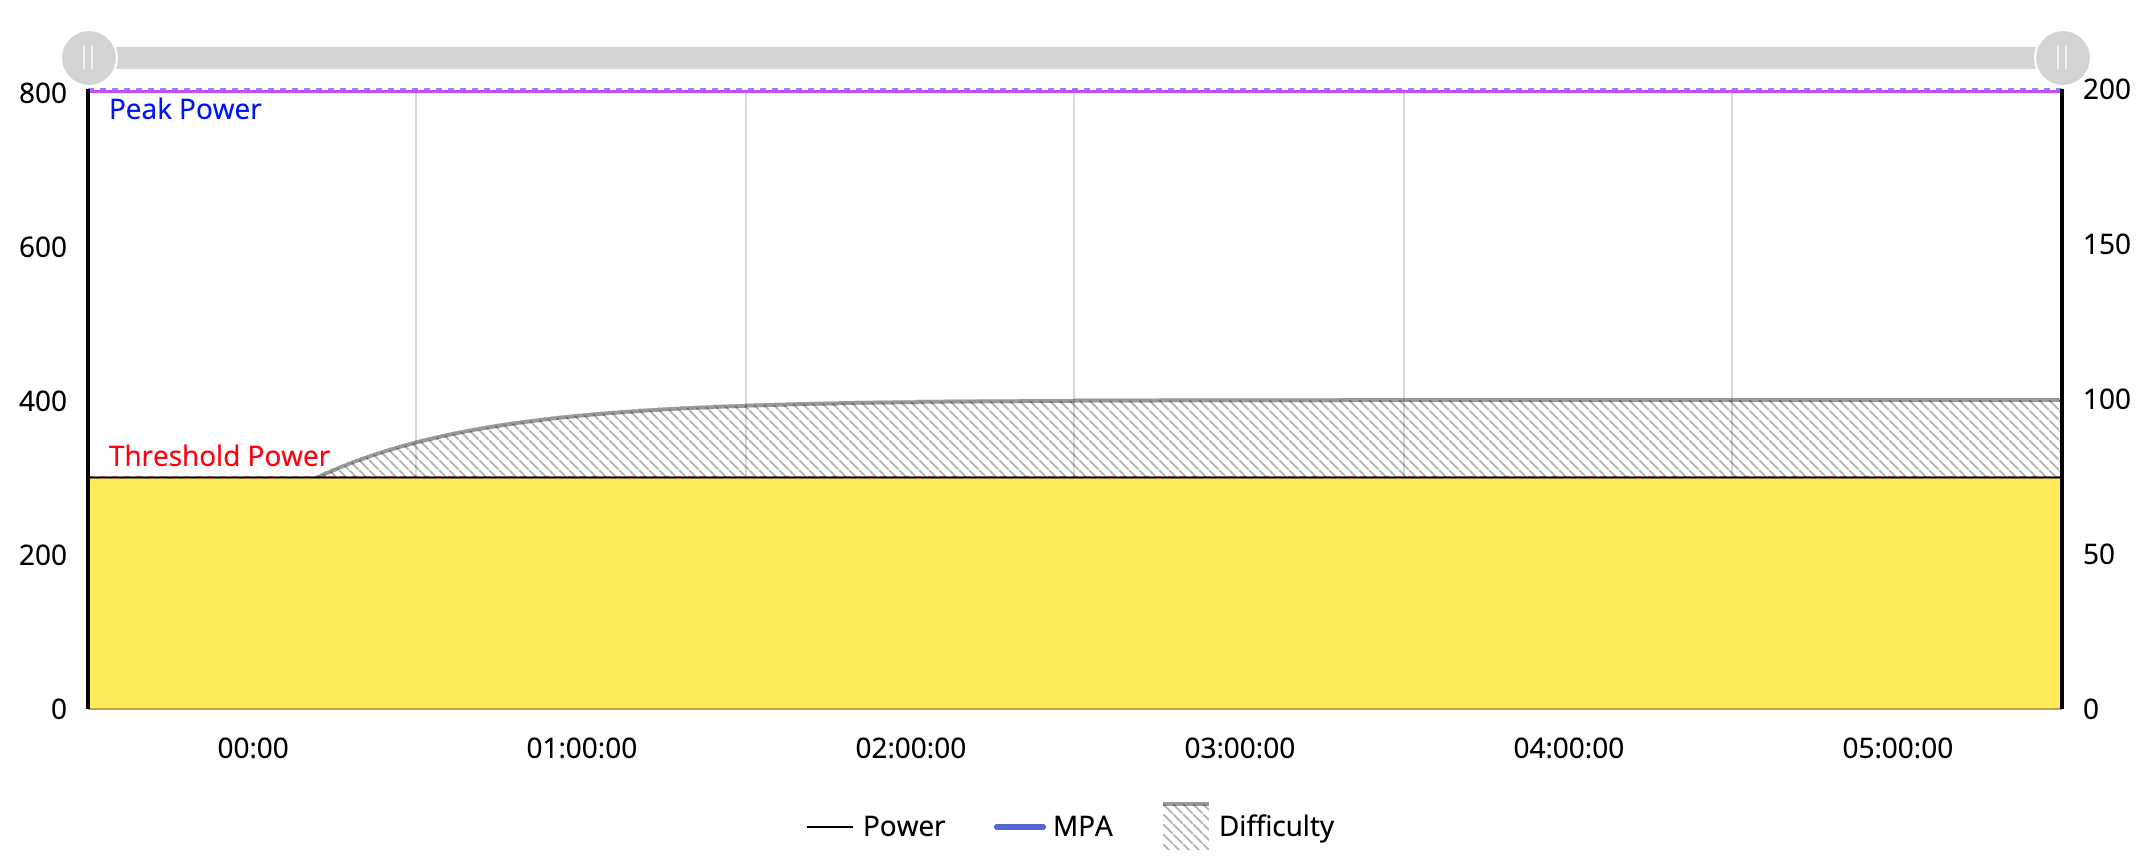
Here’s another example. Let’s compare the same workout at 82% TP:


What you’ll notice here is that the differences have a far less impact. Also, the differences in XLSS are negligible. The only difference is that XHSS gets some strain applied in 2.0 but not in 1.0.

This is more likely to reflect the total average intensity for a sweet spot focused training plan since you’re combining some sweet spot with some pure endurance. The effect on Low Training Load is negligible. Your High Training Load will be higher. Given the modest amount of XHSS, this is not likely to turn any significant number blue days into yellow days.

Now, you’re probably asking “What should I do then?”. The answer is “Unless you plan on doing the majority of your training at or near TP, you don’t need to worry.”

You have to remember, every other system out there uses TSS. TSS is a flawed metric and doesn’t separate anything into low, high or peak. It’s all the same strain. It works ok enough and if you have a sense of something being more high intensity than something else, you manually adjust your plan accordingly. This is how all these systems work. It’s a manual or “coaching” process to interpret the dose of high intensity you’ll get. It’s not in TSS. This is very blunt yet a lot of people rely on it (not sure why when there’s Xert! :smiley: )

So think about it a bit and you’ll get it. If you’re really concerned, pay a bit closer attention perhaps and adjust things yourself just like you would if you were doing something the old way. But for the moment, things work far better than any other method you’ll find.

5 Likes

Do not ask when 2.0 is going to be available. Like a good wine, it won’t be available until it’s time. :smiley: But you can see we have workouts working with it so progress is being made.

1 Like

Thanks for your clarification. How does Xert quantify the amount a certain power value below TP contributes to XSS?

I am still suprised that the two workouts I mentioned result in the same XSS, while the one at 95% TP is abviously going to be harder than the one at 85% TP.

I also think that for example a workout of 2 hours at 95% TP (if that is even possible) and a workout at 70% TP are two very different workouts, targeting different adaptations. Maybe Xert actually needs four different energy system metrics instead of 3 :wink: ?

Great news about Xert 2.0, that does seems like a logical improvement of the model.

1 Like

If you’re into the science behing the calculations, you can review [2503.14841] The three-dimensional impulse-response model: Modeling the training process in accordance with energy system-specific adaptation

This should be fully published shortly as it has gone through a peer-review process and accepted.

This has 3 systems. Adding additional systems by adding more parameters to the model is a consideration but it’s not ideal. Overparameterization creates a host of problems - adds orders of magnitude in terms of complexity and can ultimately make the model unusable.

2 Likes

Aside from the Xert 2.0 considerations as you get close to TP, the other point is recovery intensity. As you mentioned in the original post, the recovery intervals are much higher, and that matters… the on intervals are 10% higher and off intervals 10% lower… they don’t perfectly offset since the ons and offs are not the same length… and also because XSSR does not translate exactly linearly to the same fixed % TP (when below TP), even if close. I.e, 95% TP is not 95 XSSR. (An easy way to see is to create some sub threshold XSSR intervals, since XSSR is literally XSS per hour). That said, the relationship between %TP and XSSR (below TP) does seem closer to linear than the relationship between IF and TSS (where TSS is from IF^2 e.g. riding at 50% FTP gives 25 TSS per hour but much more XSS] - not sure which is more ‘correct’

1 Like

The 2.0 model looks really interesting, would’ve chewed my right arm off for something like this when I was time trialling.

Also a great way to shave weight & improve aerodynamics, I bet! :smiley:

1 Like

The current model doesn’t distinguish between riding in zone 1, 2, 3 or 4. It is just a matter how fast you gain low XSS. However, the current thinking is that you should do a mix of zone 2 and 4. I also understand that the recovery demand vs training effect is higher in zone 3 compared to zone 2.

Could it be an idea so incorporate this into the system? At least be able to track how much zone 2 we do vs 3 and 4?

With Xert I feel I am encouraged to do everything in tempo because of the XXSR.

Maybe LTP can be utilized and low XSS could be split in low and mid XSS? And instead of letting LTP be defined by TP and HIE it could be user configurable or maybe detected (breakthrough) based on power and heart rate data (heart rate drift?)?

Just being able to track this directly in Xert would be nice.

1 Like

Great ideas. Questions though. How would the different low/mid XSS translate into your fitness signature? Do we need to add a 4th dimension? If so what would it be and how would it affect your ability to produce power?

I see your point here, and I agree this is not a trivial problem. I think there are two ways to approach this:

  1. Treat this purely as informational feedback to the athlete, where zone-based work is tracked for visibility only and does not affect the model itself. The athlete can then use this information to decide how to adjust training.
  2. Keep the existing model structure, but distinguish between Low XSS used for Training Load and Low XSS used for Recovery Load. One way to do this would be to compute Low XSS per sub-TP zone (Z2, Z3, Z4) for each workout, with the sum equal to today’s Low XSS, and then apply different weightings of these components when updating Training Load versus Recovery Load. In this case, workouts generating the same total Low XSS would influence TP in the same way, while their recovery demand could differ depending on how that Low XSS is distributed across zones. For Training Load, the contribution from Z2 and Z3 would be relatively similar, whereas for Recovery Load the contribution from Z3 and Z4 would be much closer.
1 Like

Very good. Both are excellent options, in my opinion. One way to contemplate things is to think of each individual system as having different time constants for recovery load but also for training load.

Btw, in 2.0, we see high intensity, not low intensity as the system that has separated elements, especially when you apply high intensity below TP. Just as lactate builds at intensities below TP, so does high intensity XSS but there are different systems in use as intensity increases. We’re still working on this so not quite ready to provide a lot of detail. Things can still change as we understand more.

I always thought that zone 2 (around lactate threshold 1) and zone 4 (just under lactate threshold 2 or FTP, ‘sweet spot training’) have different goals and effects.

Zone 2 is about improving your efficiency at lower wattages, allowing you to burn more fat and less carbohydrate as fuel and thus allowing you to go for longer and experience less fatigue towards the end of long rides. The effect of zone 2 training on your FTP is low compared to sweet spot training.

Sweet spot training is about raising your FTP, allowing you to sustain higher wattages without going over your FTP.

Ideally, the Xert model should reflect both these training effects. But I also understand that the system is already complicated as it is, and adding further complexity could potentially make the system unpractical to use.

1 Like

There are a number of important things to consider when we talk about durability - going longer with less fatigue. Yes, lifting LTP to rely on fat rather than carbs is indeed very important. Another more subtle aspect is the difference between using blood glucose rather than muscle glycogen for energy. If you can use more blood glucose, muscle glycogen can be spared. You can replenish your blood glucose during a ride but you can’t replenish muscle glycogen during your ride. That gets replenished when you stop and rest after your meal(s). There are some power ranges we believe may improve the ability to utilize blood glucose over muscle glycogen. This is an area of research for us at the moment.

3 Likes

Good point! It would make sense to model it so that work in zone 2 contributed to an increase in LTP and that work in zone 4 increased TP. There are probably some cross over effects as well.

But if LTP was introduced as a new independent fitness signature variable, it must be used for something, otherwise it will be redundant. Is LTP your 3 hour power, while TP your 1 hour power? With current Xert you can sustain TP forever.

It would be great if Xert could help us polarize between zone 2 and zone 4. So say that we should do more zone 4 if we mostly do zone 2, and the other way around. And preferably, the polarization should be driven by the target and constraints we have in the plan. If our goal event is 5 hours we should do more LTP than if our goal is a 1 hour event.

1 Like

XMB gauge will show you how mich time you spent between 75% and 100% of LTP (Zone 2/Endurance+).

SweetSpot Training is still about replacing time with intensity. Building the middle frame stronger can make it hold a heavier roof, but it won’t build the fundamentals of riding longer than 2-3 hours. Might work for some for some time, might be the road to overtraining for others. If you find some time, use it to go lower and longer on low intensity days. As much as I understood, it is almost impossible to go too low. Too bad there seems to be no magic shortcut.

One thing to consider: many riders (me included) are more keen on having a strong LT1/LTP than any other metric. I dont care specifically about TP and PP on what I am training for: 200-600 km rides.

I would love to have a MPS (max power sustainable) number on my screen - for positive pacing in an long distance event. Something like a slowly decreasing LTP. But this seems to be a whole different area of fitness (central fatigue not peripheral fatigue), wich is by definition excluded by the CP/MPA model.

1 Like

Really interesting thread. Don’t really have much to contribute but wanted to agree with @spirit68 and @hpbieker - I’m also training for ultra distance/bikepacking events so am only really interested in LTP (well maybe increasing TP, buts thats only becuase it pulls up LTP).

Looking forward to Xert 2.0 - be nice for Xert to differeniate between my Sweetspot and easy Endurance workouts :clap:

1 Like

It is my understanding that in the Xert model, LTP stands for the minimum power you can sustain when your MPA is at the lowest level (i.e. after a maximal effort). So I do no think that LTP is the same as LT1? Feel free to correct me if I have this wrong.