I imagine many of you have noticed that we don’t offer a lot of laps or interval-based features. Nor do we do historical power curves (i.e. your power curve based on best “MMP” or “mean maximal power” efforts in the past). Laps/intervals/MMP are useful when you’re looking to make sense of progress when you don’t have MPA. With MPA, you get the explanation, i.e. the story, of what happened in your ride. Reviewing data without MPA doesn’t provide this picture. Here’s an example:
Firstly, I’ve never done this analysis before since I don’t see the point but for those that come from this sort of thing, here’s how you might see what’s really going on.
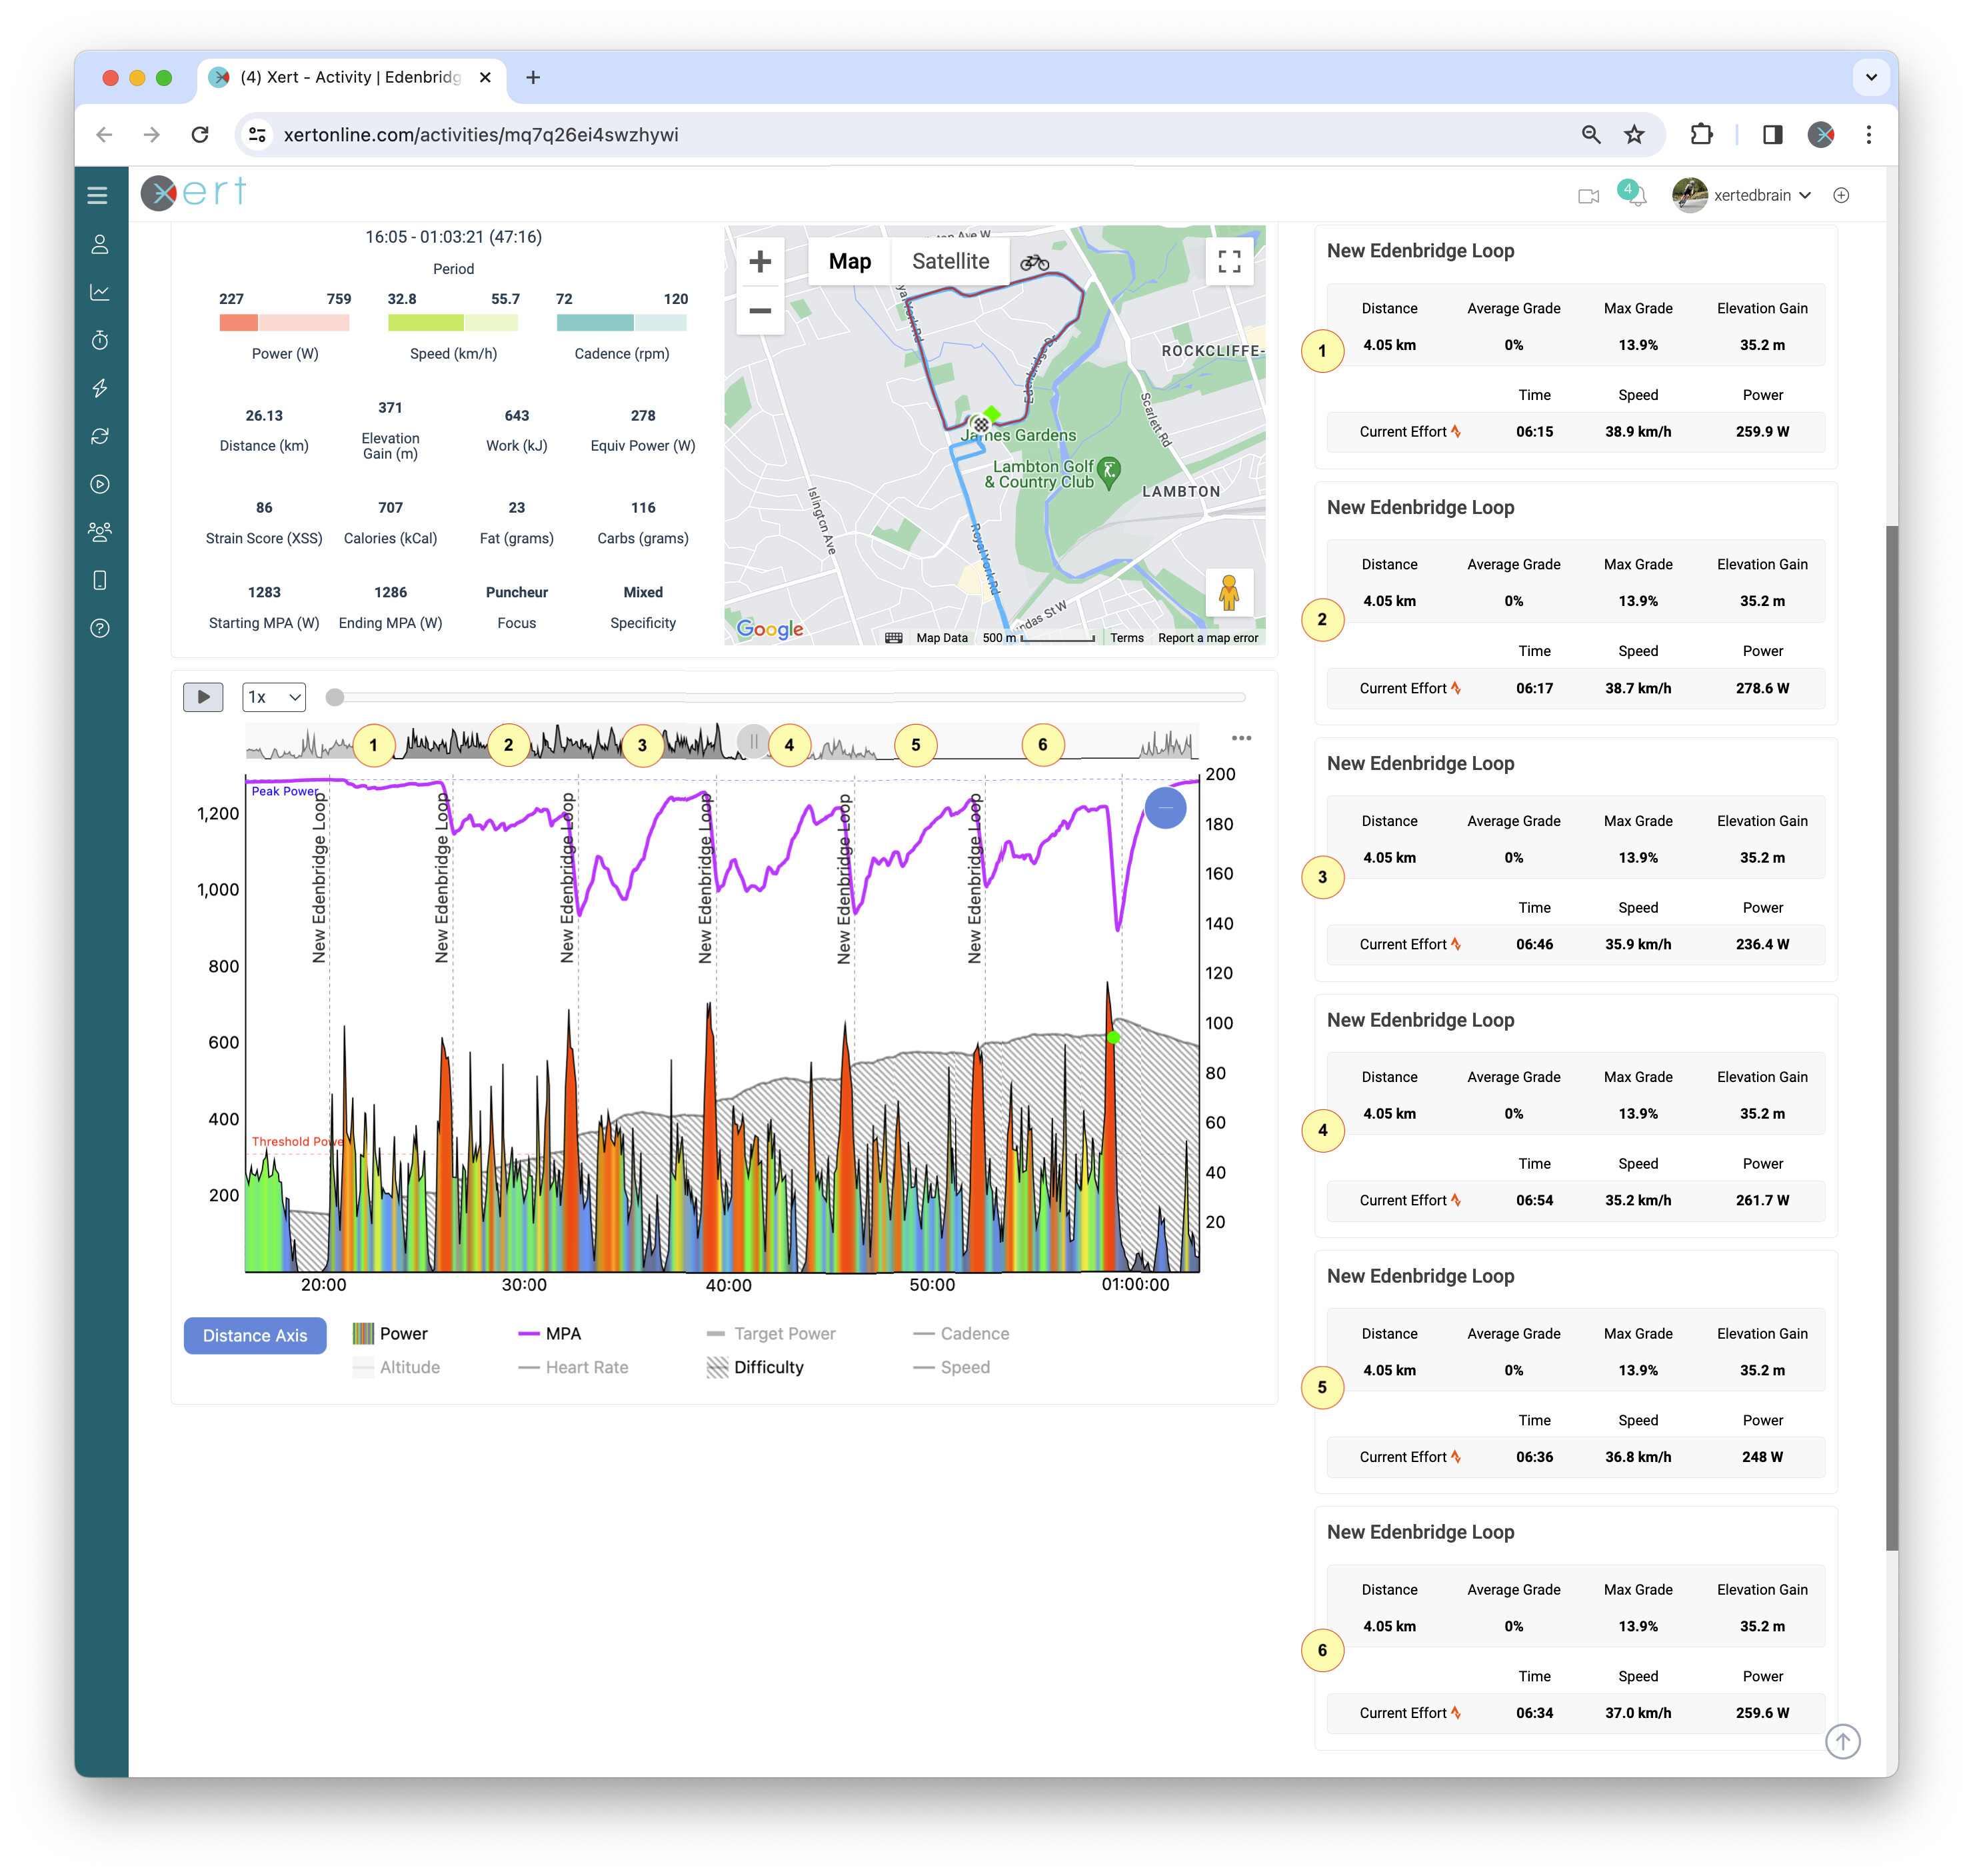
There are 6 laps in this ride. It was today’s ride for me. You can view each lap by mousing over the Strava segment in this case. If you have laps, you could mouse over / click them. I superimposed all the segment markers and annotated each of them to demonstrate (not something you’ll see on the system, in other words).
Notice how each lap has different average power. We don’t show XSS on the side panel. I’d like to add XSS and now also low, high, peak XSS in support of the XFAI… but this page is getting an overhaul so we’ll have to make due with what we have atm. XSS for each lap was 10, 14, 14, 16, 14, 15 respectively.
As you can see, with MPA elevated and difficulty down, it was pretty easy to get a better average power on lap 2. Lap 3 had just as much XSS but since MPA was down, it took 40W less. Lap 4 had the most XSS but power was no different than 1 and 6.
I don’t see how looking at these intervals without MPA gives me any added understanding of what’s going on. In fact, I can look at them with MPA to compare them but that mostly reminds me of what was happening rather using this comparison as something that will inform my training or performance decisions. The last lap is the main lap that I need to improve. But I don’t need to compare laps to understand that. I just need to see where my MPA was and where it ended to know that I need to keep training and practice digging deeper at the end.
Rarely in rides and rarely in racing do you ever see an effort from fresh to exhaustion. If they do show up, there will be a short pause or break somewhere, suggesting that your actual MMP would be higher than what the average power showed. (Common practice by coaches doing CP/W’ testing is to do them in a lab and not rely on field data for this reason).
Xert captures breakthroughs. I’ve been asked “So what power did I get the breakthrough at?”. The answer to that is "You’re thinking about things using old-school think. With Xert, MPA tells the story and when you breakthrough, 1 or more aspects of your fitness have improved/changed. These yield improvements/changes across your entire power curve and not just one point. Fitness doesn’t build at various parts of your MMP power curve, part-by-part. That’s old think. You improve those elements that make your capable of doing various efforts that make up your MMP curve.
Many often go back to verifying what the Xert predicts and do a 10 minute test, for example, only to realiize Xert had it right or sometimes realizing that a short 1-4 minute effort is damn hard to do just perfectly where you start fresh, maintain an unbroken constant pace, changing gears at the right time until you can’t turn the pedals to sustain the power at the exact moment when you cross the line/end the interval. Just doesn’t happen that readily and takes a ton of practice for shorter efforts.
So I really don’t pay attention myself the laps/intervals/MMP. They don’t offer any additional understanding to what Xert already lays out for me.