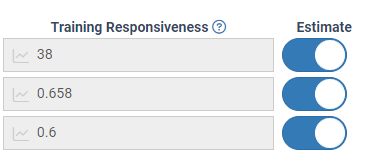
Just found this Training Responsiveness in Account Settings. Is there any post to explain this setting?
Yes i spotted this last night too. It would be good if xert provided information on changes they make either before they make the change or at the time of the change. Ive been an xert subscriber for almost 3 years now and ive lost track of the times ive seen an addition or change with zero explanation.
1 Like
would be nice to know how it works and what it does as well as what a change to it does
1 Like
Our community always has a sharp eye! ![]() This is just a part of a bigger release that we have on the way!
This is just a part of a bigger release that we have on the way!
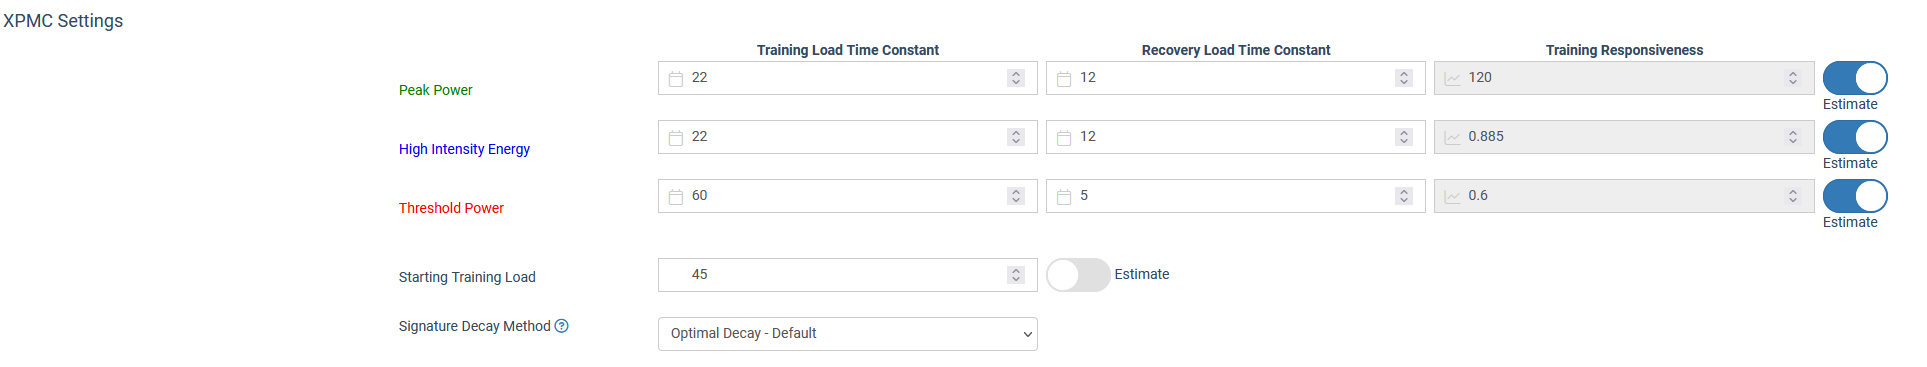
These values have always been calculated for you behind the scenes - in fact, it’s an important part of the secret to Xert’s ‘No Decay- Training Load Matched’ method to calculate your fitness signature without any need for Breakthroughs or testing.
In short, responsiveness reflects how much your signature parameter(s) materially changes when you increase your training load(s). The higher the value, the more ‘responsive’ you are to that type of strain (XSS). We know & expect the values will vary from athlete to athletes. In fact, coaches might often find that a training approach that works well for one athlete might not work well with another, and we would suspect that training responsiveness could be part of the reason. Training Responsiveness will allow coaches (and athletes) to better understand how they respond to training, as well as help Xert further recommend the most optimal training for each & every athlete! Pretty neat ![]()
FWIW, I wouldn’t recommend changing the values. Should only need to be adjusted if your data is messed up ![]()
4 Likes
hmmm i’m not so sure about that Scott as even after your explanation I’m still not any clearer on what they mean and/or do.
If you and I both train to 90 Training Load by following the same exact workouts, will we both end up with the exact same Threshold Power, HIE, & Peak Power?
Probably not because we both respond differently to the same training!
These are simply values that help us capture that ![]() You won’t find this anywhere else since every other app tracks fitness uni-dimensionally. Doing so lacks the ability to identify the material difference that high-intensity or sprint intervals make to your fitness versus base/endurance training. With Xert, you know that Sprint Intervals will specifically increase your Peak Power & High Intensity Intervals will specifically help train your HIE. These values help us understand how much your TP, HIE, & PP respond to Low, High, & Peak XSS, respectively.
You won’t find this anywhere else since every other app tracks fitness uni-dimensionally. Doing so lacks the ability to identify the material difference that high-intensity or sprint intervals make to your fitness versus base/endurance training. With Xert, you know that Sprint Intervals will specifically increase your Peak Power & High Intensity Intervals will specifically help train your HIE. These values help us understand how much your TP, HIE, & PP respond to Low, High, & Peak XSS, respectively.
3 Likes
Thanks Scott. That helps me a bit more. So - Basically i need to - LEAVE IT ALONE!!!
For now, yes, haha. We have a support doc in the works and I’m hoping with some more data, I can share some typical ranges & provide a bit more context.
As previously mentioned, this is a small part of the next big feature ![]()
2 Likes
I’m looking forward to the new big feature release.
cant wait to see what is in the next big release!!! when is it going to drop?
1 Like
Anymore news on this? Just thought I’d ask as I just had a 20w jump in LTP haha
1 Like
But Scott, this is problematic. Endurance adaptations are intertwined. For instance, lots of volume at low intensity will raise your power curve across the curve.
You’re not wrong that increasing TP will always result in increased power across all durations. But we already account for the fact that your entire fitness signature is used to construct your power duration curve. Remember that TP becomes a lesser contributor as the effort duration decreases… that’s where HIE & PP start to play a much bigger role. If your goal is to maximize 10s power, you wouldn’t train for it by doing lots of low-intensity volume… you would want to increase PP & HIE as much as possible by doing short, supra-maximal efforts.
But because I’m a nerd who likes numbers, let’s take a look at some examples:
Lets start with an example athlete:
1000 W PP | 20.0 HIE | 250 TP
This signature provides the following PD curve:
10s: 917 W
1 min: 517 W
3 min: 353 W
5 min: 314 W
10 min: 283
If this athlete trains only their low intensity system and boosts TP by 10% (for them, 25 W), we still expect to see increases all across their PD curve…
1000 W PP | 20.0 HIE | 275 TP
New PD Curve:
10s: 924 W
1 min: 540 W
3 min:378 W
5 min: 339 W
10 min:308 W
However, this athlete would see far greater improvements in short duration power if they were to focus on HIE/PP by doing very short & all-out sprints. If they don’t add additional low-intensity volume, we expect their TP to remain relatively constant, giving us the following signature:
1200 W PP | 22.5 HIE | 250 TP
10s: 1073 W
1 min: 558 W
3 min: 367 W
5 min: 322 W
10 min: 287 W
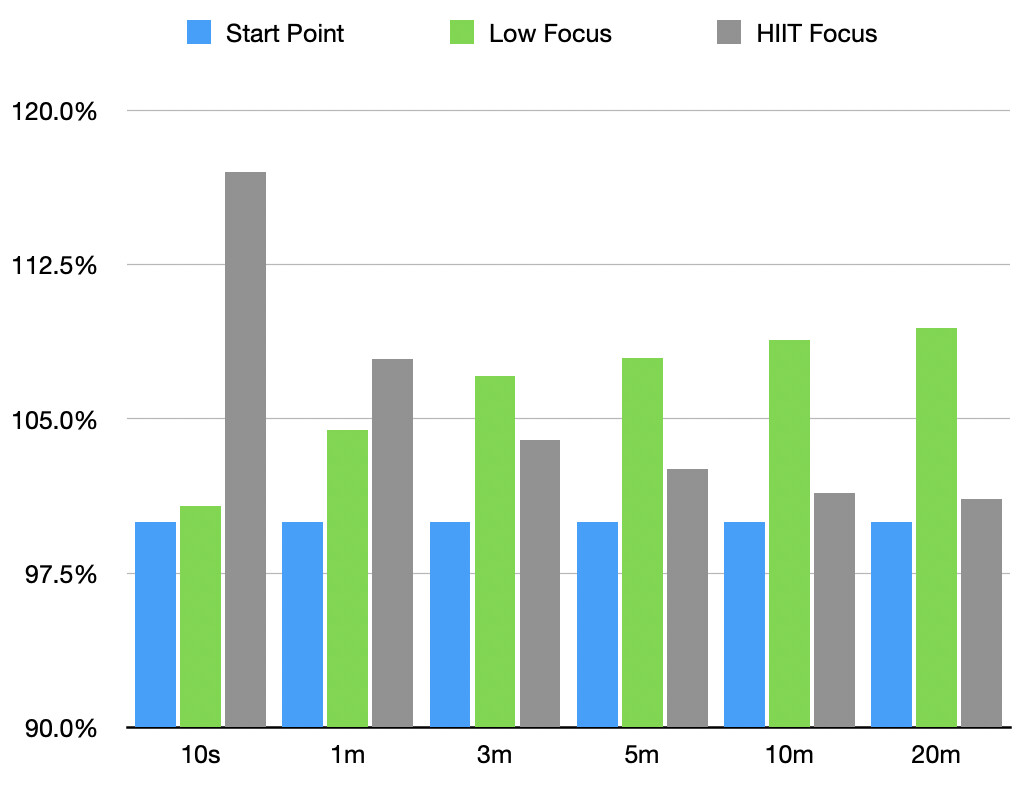
That’s lots of numbers… it might be easier to visualize this… this shows percent change (vertical axis) for Low-Intensity focus training (green bars) and HIIT-focus (grey bars) relative to the athlete’s starting signature (blue bars, all at 100%). Note that increasing an aspect of your fitness signature always results in increases to your PD curve… you will see that the grey & green bars are always above the starting/control signature in blue!
-
In general, where grey is taller than green indicates where improvements to HIE & PP (from Sprint & High-Intensity training) training would out-perform low intensity (base) training in your power duration curve. Notice this generally happens only for very short power durations (<3 min).
-
On the other hand, places where green bar is taller than grey would indicate that a low-intensity ‘base’ focus would out-perform the HIIT-focus training. As expected, low-intensity training will help increase power pretty much across the board, but even more so for your 3+ min power.
All that being said, this is a simplified example. It’s not really possible to only train your HIE/PP - everything works through your low intensity system. The idea above is just to show that increasing any aspect* of your fitness signature will result in increases to your PD curve. Increasing TP will generally provide a bigger boost to your 3+ min power, while increases to HIE & PP will provide a bigger boost to your <3 min power. Hope this makes sense!
5 Likes
As there is no update in the documentation yet, it would be interesting to get some comparison values for the Training Responsiveness values!
These are mine:
29m, got into cycling in 2021 with around 5k km per year.
TP is (except during winter) hovering between 270-300W most of the time at a weight of 71-74kg.
1 Like
I haven’t seen many of these values myself yet. Perhaps something I’ll dig into more once we get the new features released.
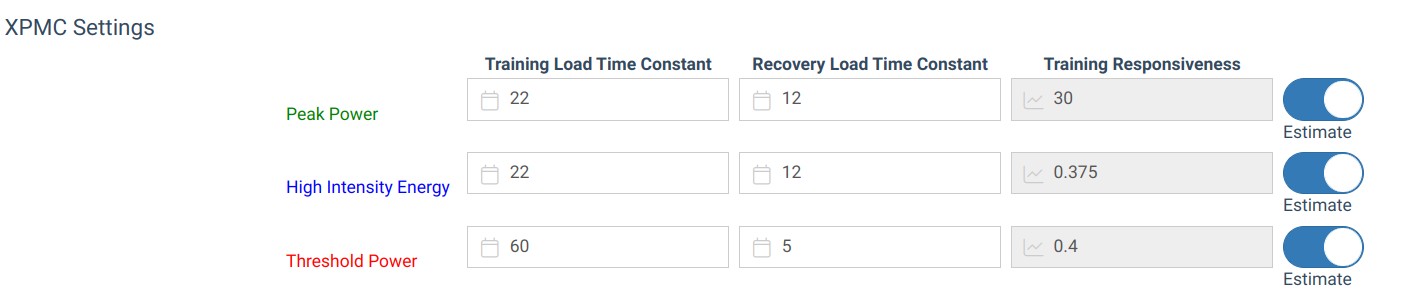
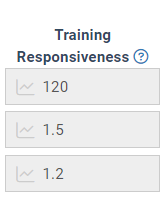
Here are where we might expect the values to fall. I suspect the data will be more accurate with more (complete) data in your account and a decent number of breakthroughs recorded in your profile across different training loads.
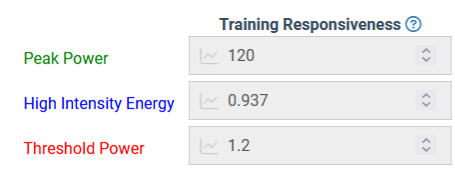
PP: 30 to 120
HIE: 0.375 to 1.5
TP: 0.4 to 1.2
Here’s mine!
At 67 kgs, I tend to hover between 240 W at the lowest and up to ~280W (max of 300 W). HIE is typically near ~20 kJ’s. Can get it up to ~25 with a good amount of HIIT training featuring lots of micro-intervals.
1 Like
Hi @ManofSteele,
Here are my numbers.
Is there a way a person could manage their training knowing their numbers? For me, it seems like I am really responsive to PP training, so would it be wise for me to pick a higher MMP athlete type to focus on TP and HIE training, and then sprinkle in PP training close to events that require PP (ie cyclocross)?
I’ve tried to make this point to so many people, such a simple concept but people refuse to accept it. They think that the winner of the tour de france did it by simply out working everyone else. No, they were born with a genetic gift. That doesn’t mean they didn’t work as hard or harder than everyone else also. However, it does not mean they worked harder than the guy that finished 90th either. As a Cycling coach I saw this clearly in the athletes I trained, some are donkeys and some are race horses.
1 Like
Based on the data that we have in the system, it seems that you respond well to Peak Power training (which is actually quite common, it’s just that most users don’t increase their Peak Training Load very much - for example, my Peak TL right now is 0.1 because I haven’t been doing any sprint work lately).
I think that’s one way to look at it… focus on where you’re weak & save your more responsive training until closer to the event. Or, on the other hand, focus a lot on where you’re already responding well (e.g. maximize on your strengths), then add in the other aspects of your fitness around it.
I suspect the other part of it is your ‘untrained’ signature… There has to be some baseline fitness for all athletes (e.g. if their training load was essentially 0, what would we expect the signature to be?)
For example, I know that even when I haven’t been riding much, I can expect my FTP to be around XYZ watts. A professional rider’s ‘untrained’ fitness signature is likely much higher than mine (as well as them likely responding to training better than me). I suspect this (in addition to training responsiveness) is what separates many professionals from amateur/recreational athletes.