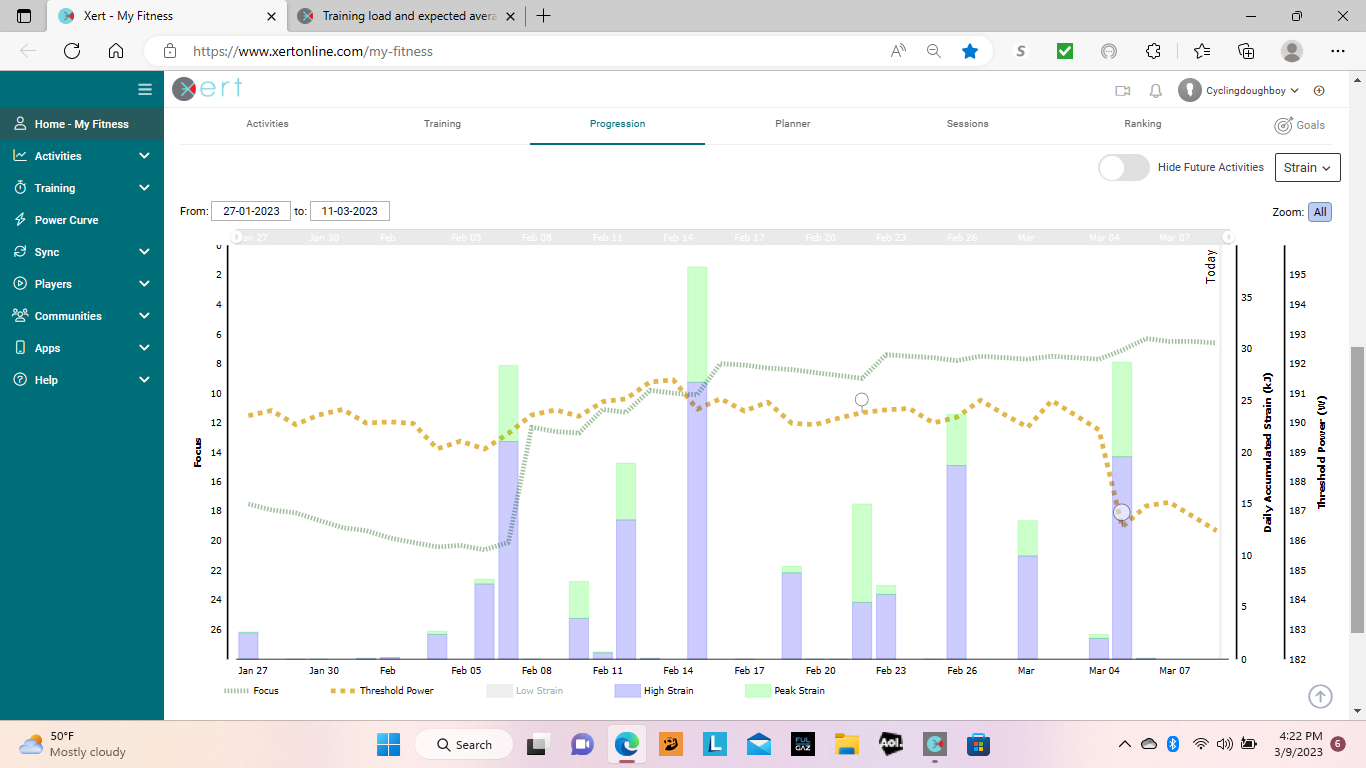
I did play with the freshness slider especially when I was feeling good but when I set it back it put everything back into the yellow status.
Here is what I have done in the past 6 weeks as you suggested, the drop in TP was from a near breakthrough, there were a few days of very nice weather where I got off the trainer and went outdoors for some longer (time wise) endurance rides finishing with some intervals which may have complicated what Xert sees to determine my tired status.
I would expect to see a mild relationship. But I think how you get your TL would greatly affect what metrics it affects. I could get a very high TL by doing lots of very low endurance rides, but my PP would still be very low. I imagine the inverse might be partially true as well where a track sprinter’s TL might be very high but there TP could be very low. Other than saying more training targeting what you want to improve is likely to result in improvement it would be pretty difficult to forecast. That being said I like experiments:
TL 98
TP 290
HIE 24.5
PP 1071
LTP 229
Weight 85kgs
Height 180cms
Age 43
Currently halfway through Base period of training with a climber focus.
2 Likes
The training you are doing is what I was expecting in the Base period for suggestions from XATA, but I find the suggestions are usually more pushing to get the most XSS in the focus type set. Essentially sweet spot most of the time. So nothing really suggested for below LTP. If I did more polarized intense sessions would XATA likely start making these suggestions for lower intensity to balance things? It seems like both methods will get you to the same place but I find continuous Sweet Spot to be a challenge beyond a few weeks.
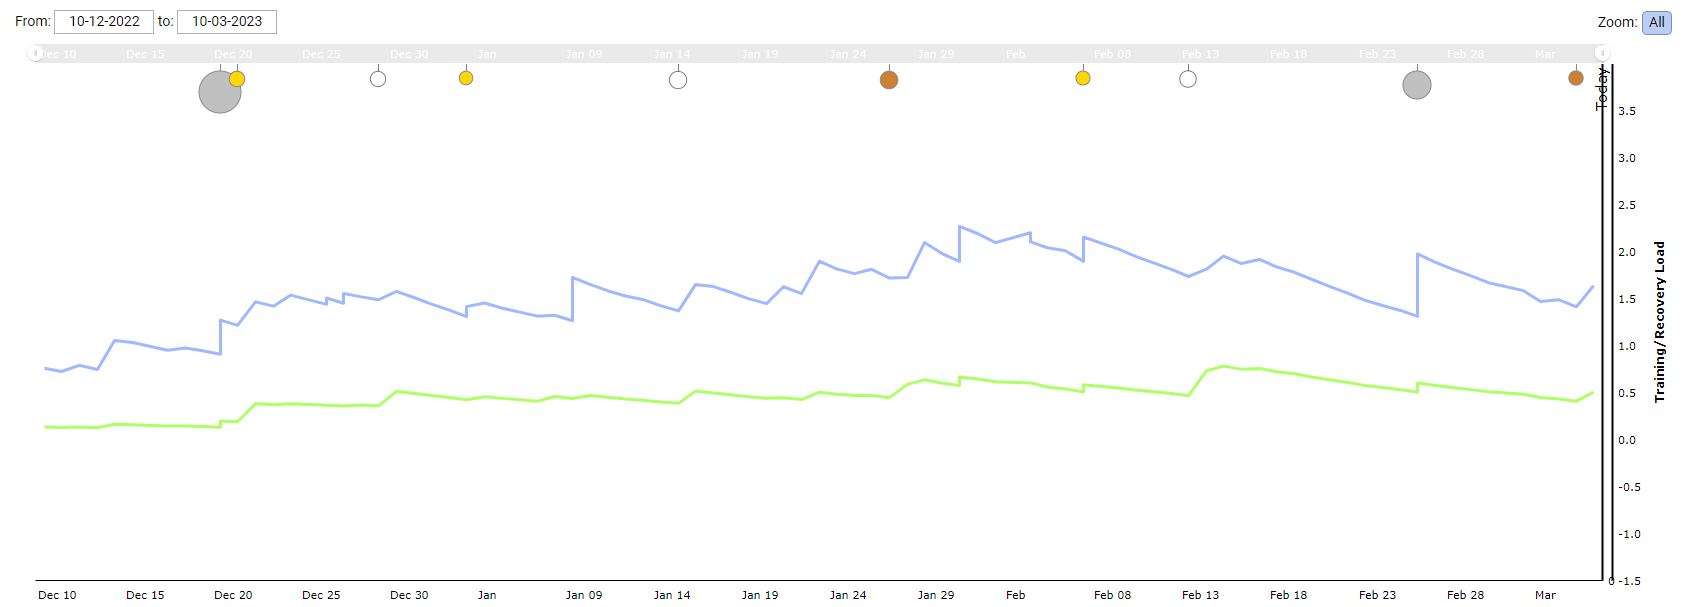
I was curious seeing everyone posting their TL broken down further, so I went and checked mine out. High peaked at 2.2 and Peak peaked at .8. If someone was interested in training these specific targets what would reasonable TL be expected to rise to? I assuming that it could never approach the Low intensity TL number? I also stripped out the Low for a better comparison.

On small decay
TL = 63.4
TP = 261
PP = 989
HIE = 20
Weight = 79.5
Age = 58
Dave I think your numbers are mixed up
1 Like
Your HIE Ratio is coming out at 38. You might want to check this out as per Armando’s previous posts.
Thanks @oldcyclist65 for helping me update the sheet!
I have now added Dave as well and updated the scatter plot (see below)
I think George meant you @Yves82 when he was talking about the ratio of 38. Dave’s ratio is at 29, which is in the normal range. Yours though, Yves, does look a bit weird. So maybe your PP is not correct, or your TP is below where it should be.
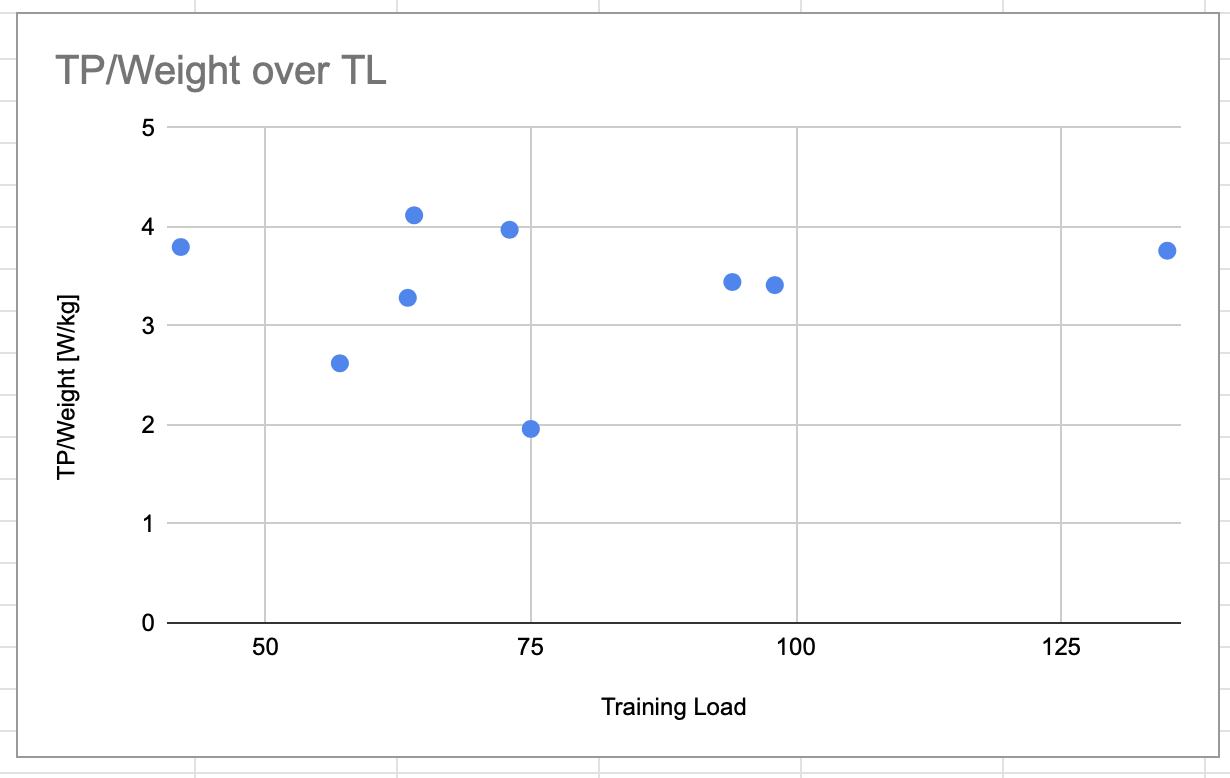
Again looking at the results so far, it almost seems like there is no connection to training load at all. It really does seems weird. But then again, it’s still not a lot of data points. I will try to play around with visualising my training efficiency metric later though. Because while the chart above doesn’t show much, looking at the training efficiency metrics, there are huge differences between all of us.
Thanks everyone for the data and please keep it coming!
1 Like
Hi Luca,
No problem. No I was saying to Dave that his numbers were mixed up. He’s edited them since I mentioned it.
My other comment was to Yves about his ratio being high.
Thanks for the heads up! I flagged a recent breakthrough which appears to have some potentially faulty data.
The update parameter estimates now are
TL = 142 (139, 2.5, 0.5)
TP = 311
PP = 1006
HIE = 24.3
Weight = 87
Age = 40
Which gives me a ratio of 34.96. The values appear to be in line with my riding apart from PP, my max 1 sec effort this season was 862W. Maybe my HIE is estimated a bit too high, intervals.icu gives me a smaller value.
Edit: let me rephrase it: I do not think the data is “faulty” but I think the efforts I do for breakthroughs might “break” the modelling equations. Heard something like that from Kyle Moore (?) I think. I do the max effort on a slope which gets quite steep in the end, and after i basically already maxxed out my threshold/VOmax2 limit I can still generate quite a big anaerobic effort as I am apparently a “punchy” guy. No way I could hold the TP of 327 from that estimate for up to an hour, so the big anaerobic capacity biases the model estimates.
3 Likes
Thanks for sharing this Yves, I have been wondering the same about my TP. Not sure I could maintain it for an hour (though i’d love to be able to). I wonder if there is a good BT workout that targets punchier riders, in that it doesn’t play to their strengths as much. As I much prefer the punchier stuff I think I might be choosing BT workouts that favour that style and strength of riding. I will have to try and adapt that into the future.
2 Likes
Here you go!
TL 60
TP: 221
HIE: 24.7 kj
PP: 1,039 W
Weight: 84 kg
Age: 58
1 Like
Oops. yup I’ve just corrected it with the addition of peak power
1 Like
I’ve added an “Age” field so that if we think it’s needed in the calculation it’s available so to speak.
I’ve added your numbers Marc @1k2go
2 Likes
So I’ve been a bit busy the last couple of days, but I thought an update of how the chart looks and some random thoughts I’ve had would do this thread some good.
So let’s look at the chart first:
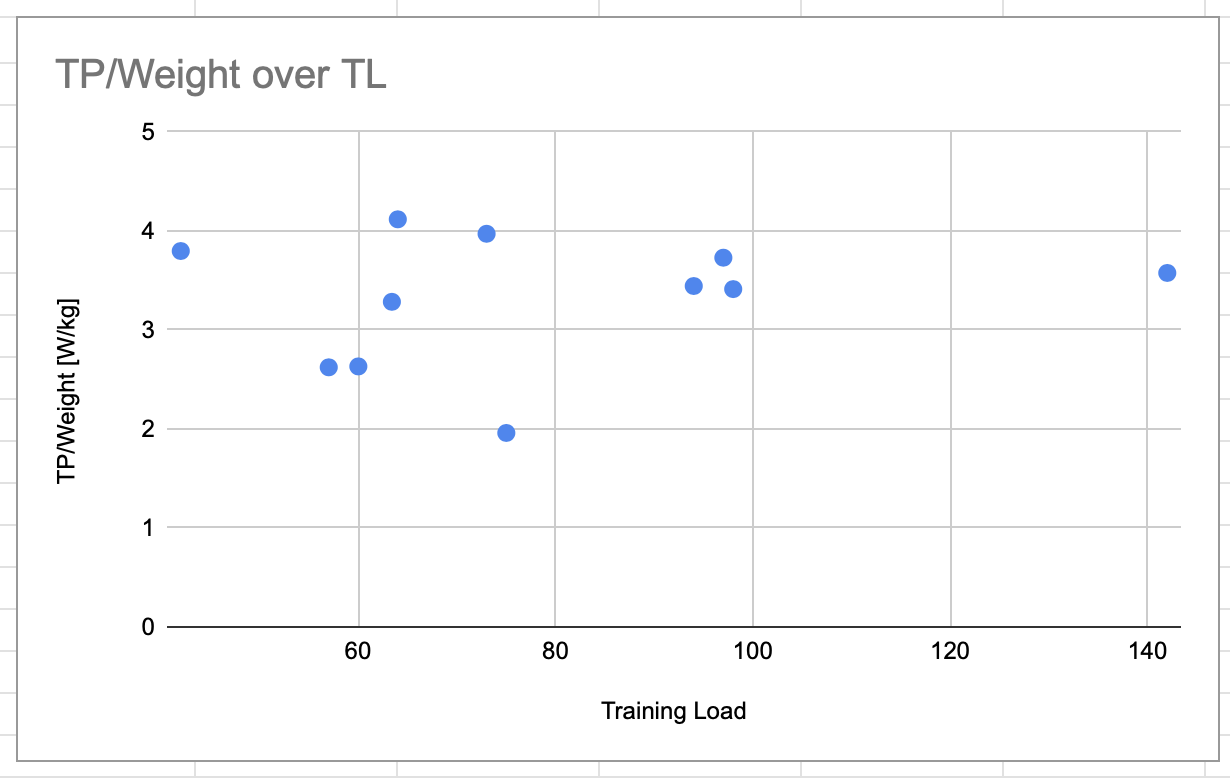
Still seems like there is literally no connection between training load and TP.
Let’s look at W/kg over age next:
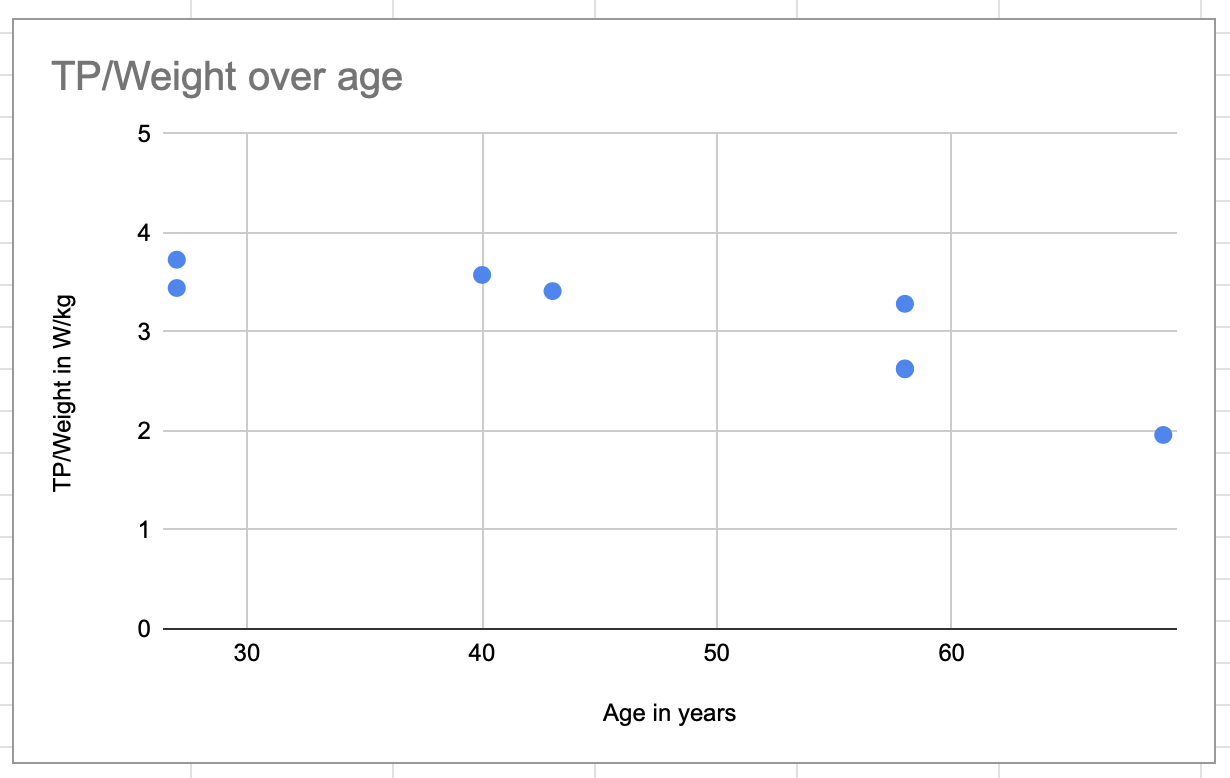
Yep, pretty good correlation there. (Obviously not enough data points to really be statistically significant but good enough for our purposes I guess).
Unfortunately we don’t have age entries for all our data points so we can’t work out a good factor to correct for different ages just yet.
Another curious thing I hit my head on today:
I did a Zwift ramp test because I was simply curious what it would say. I read a bunch of articles on the internet and it’s supposed to be a bit high for sprinters/more punchy athletes and maybe a bit low for long endurance riders. I was really quite tired though so I thought the result wouldn’t be all that bad. It turned out I got an FTP of 261W whereas Xert decided this same workout was a near BT for me and gave me an FTP of 239W. Now, that seems kinda crazy. In addition to that Xert had a hiccup yesterday and I had make it recalculate my fitness signature. You know what it came up with? 270W.
Manually edited some BTs so it would have more HIE and less TP and got it back to my old fitness signature which felt a bit more realistic (and gave me a more realistic HIE to PP-TP ratio). I still decided to calculate a fitness signature based on the TP result of Zwift today and added it to the chart.
here are the two results compared:
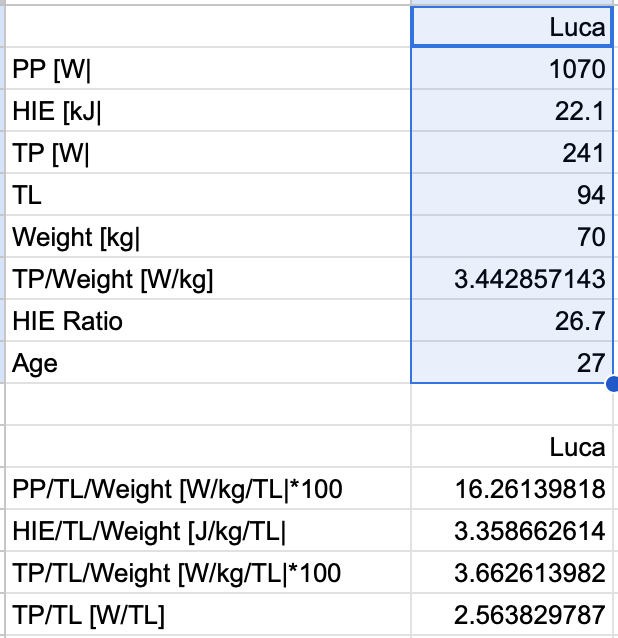
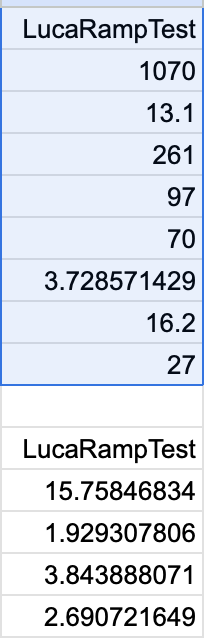
So obviously the ratio on the ramp test result seems very weird (but is in fact very close to what Xert would put me if Scott hadn’t edited my fitness signature manually a couple of months back) but how can it be that far off? Also, Xert does seem a bit like a RNG at times. I had it recalculate my fitness signature multiple times yesterday and got everything from 270W TP to 260W TP.
I’ll do another ramp test next week when I’m (hopefully) a bit more rested and fresher because I think without my legs already hurting before the ramp test I could have easily held on another 30 seconds or even a minute. Getting me to 270W or something like that. That would be a 30W difference to what Xert thinks right now…Weird!
2 Likes
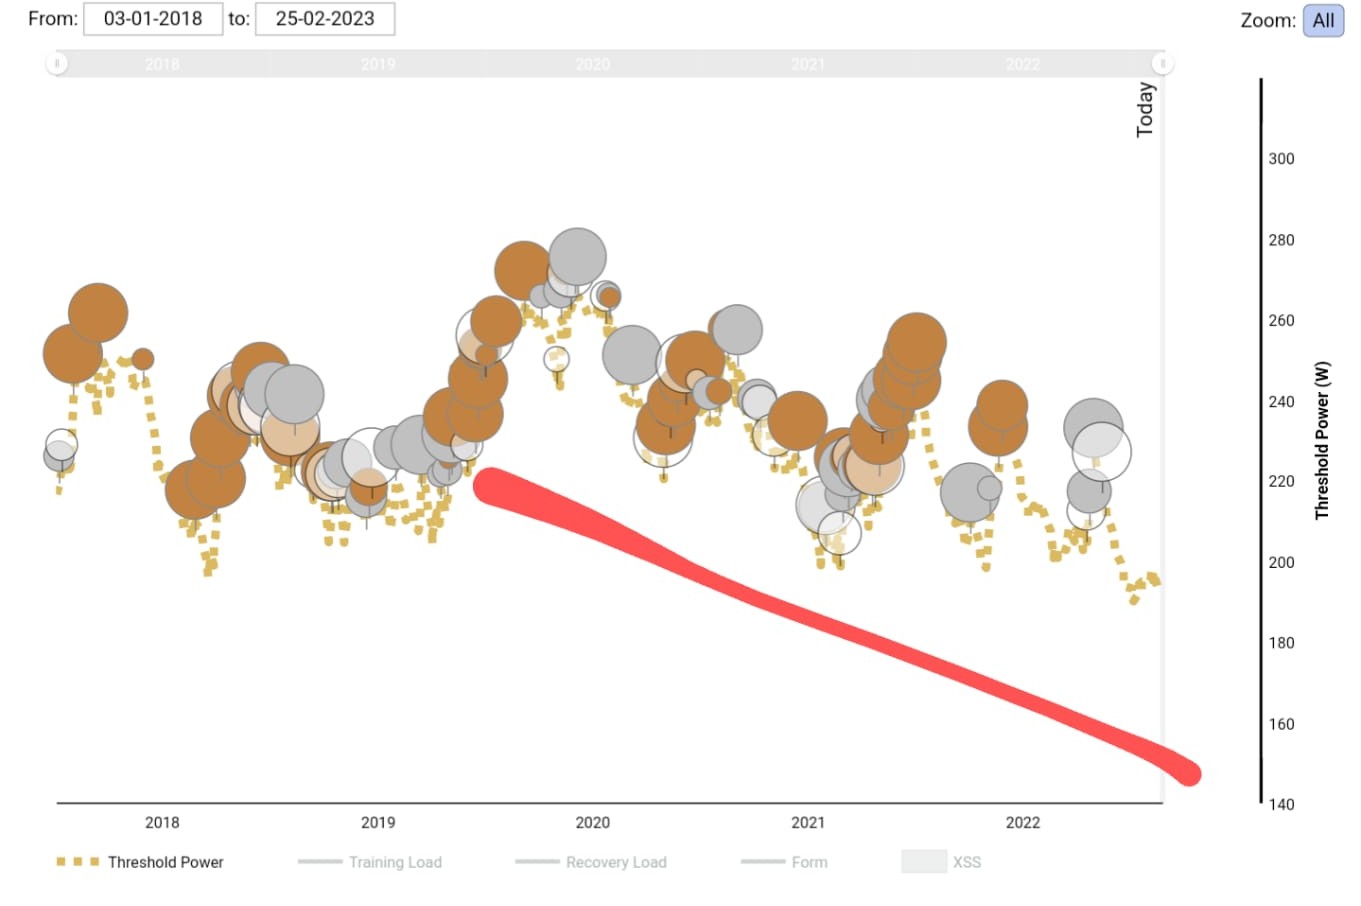
Like Scott said earlier, TP for me is related to my TL, but loosely.
I once downloaded all my breakthroughs (5 years of data) and mapped out TL vs TP…and it gave me a very fuzzy line. That showed there was a positive correlation, but it wasn’t telling the full story.
E.g. Here’s an interesting period of my data:
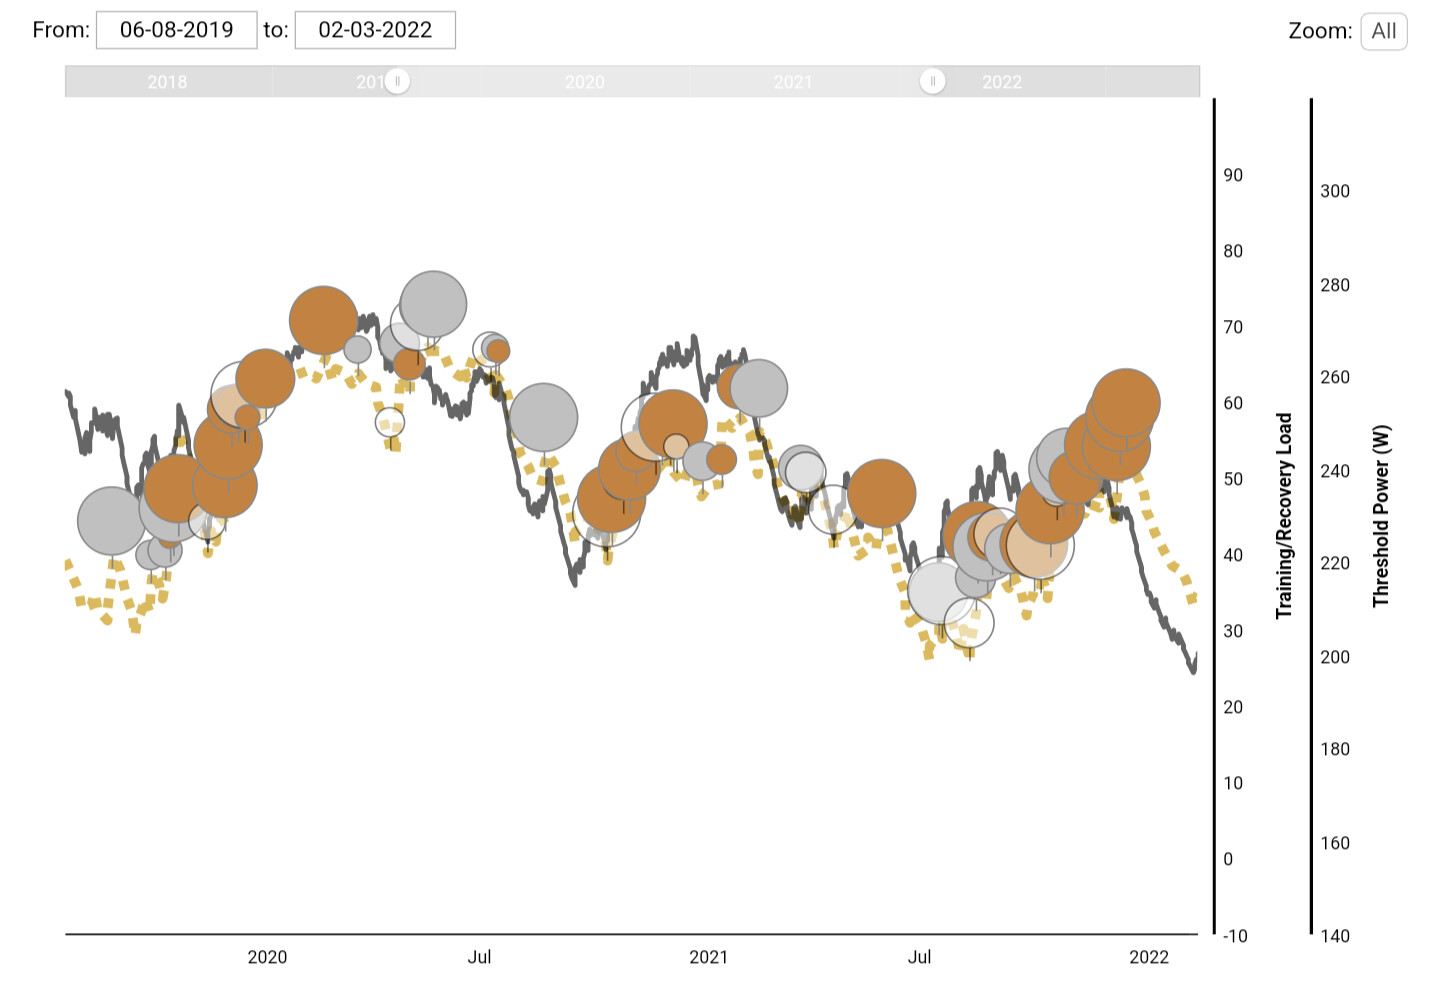
Zooming in on the first consistent rise in TP you have 3 key data points (assume weight was ~68 (+/-1kg) and i was 34yo):
Start of base in Dec 2019 (and zwift racing):
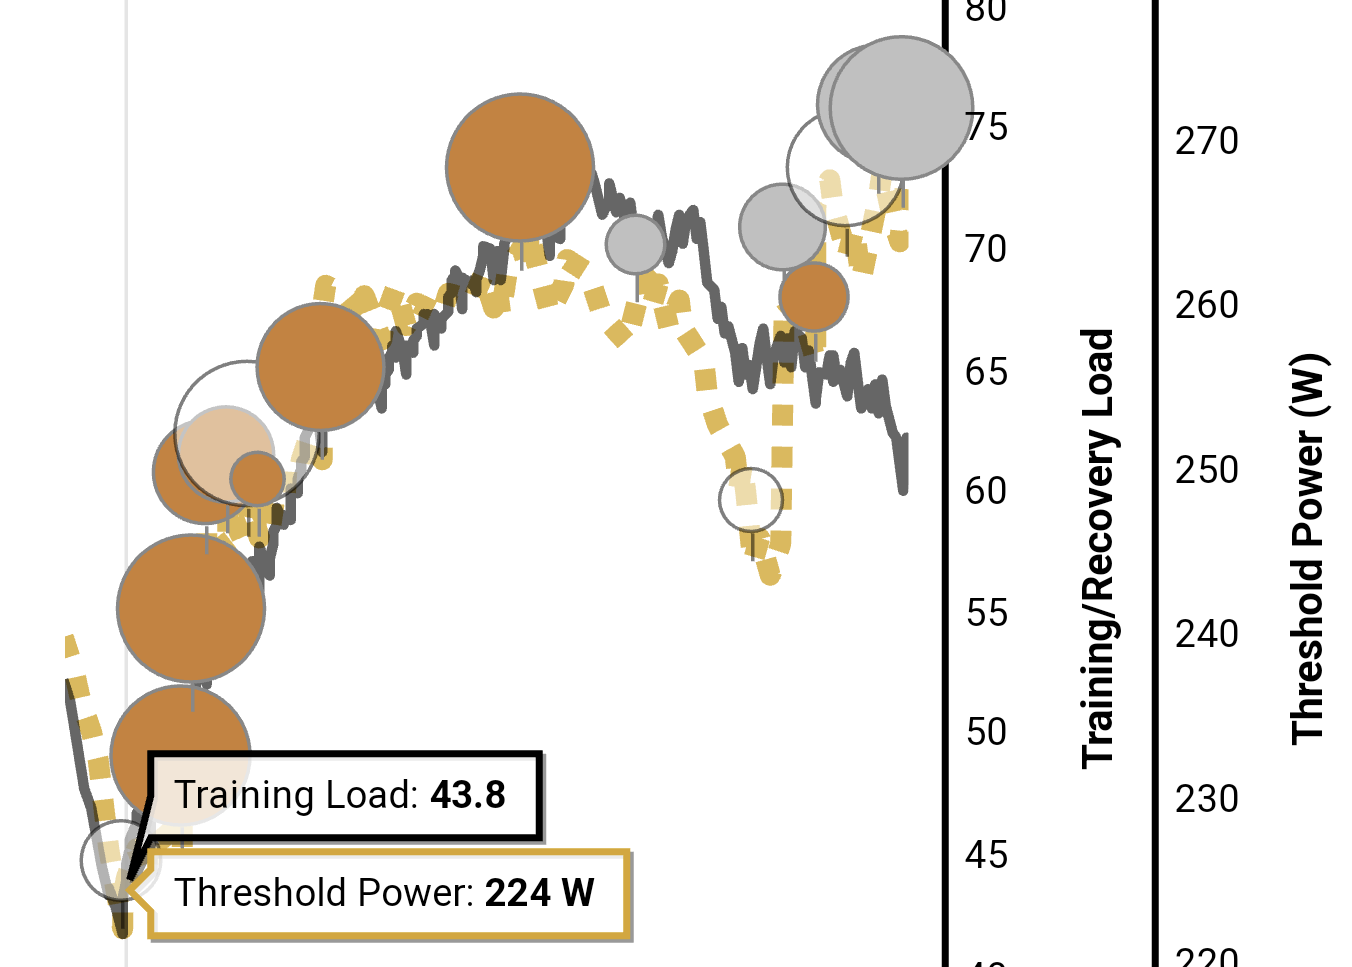
First peak in March 2020:
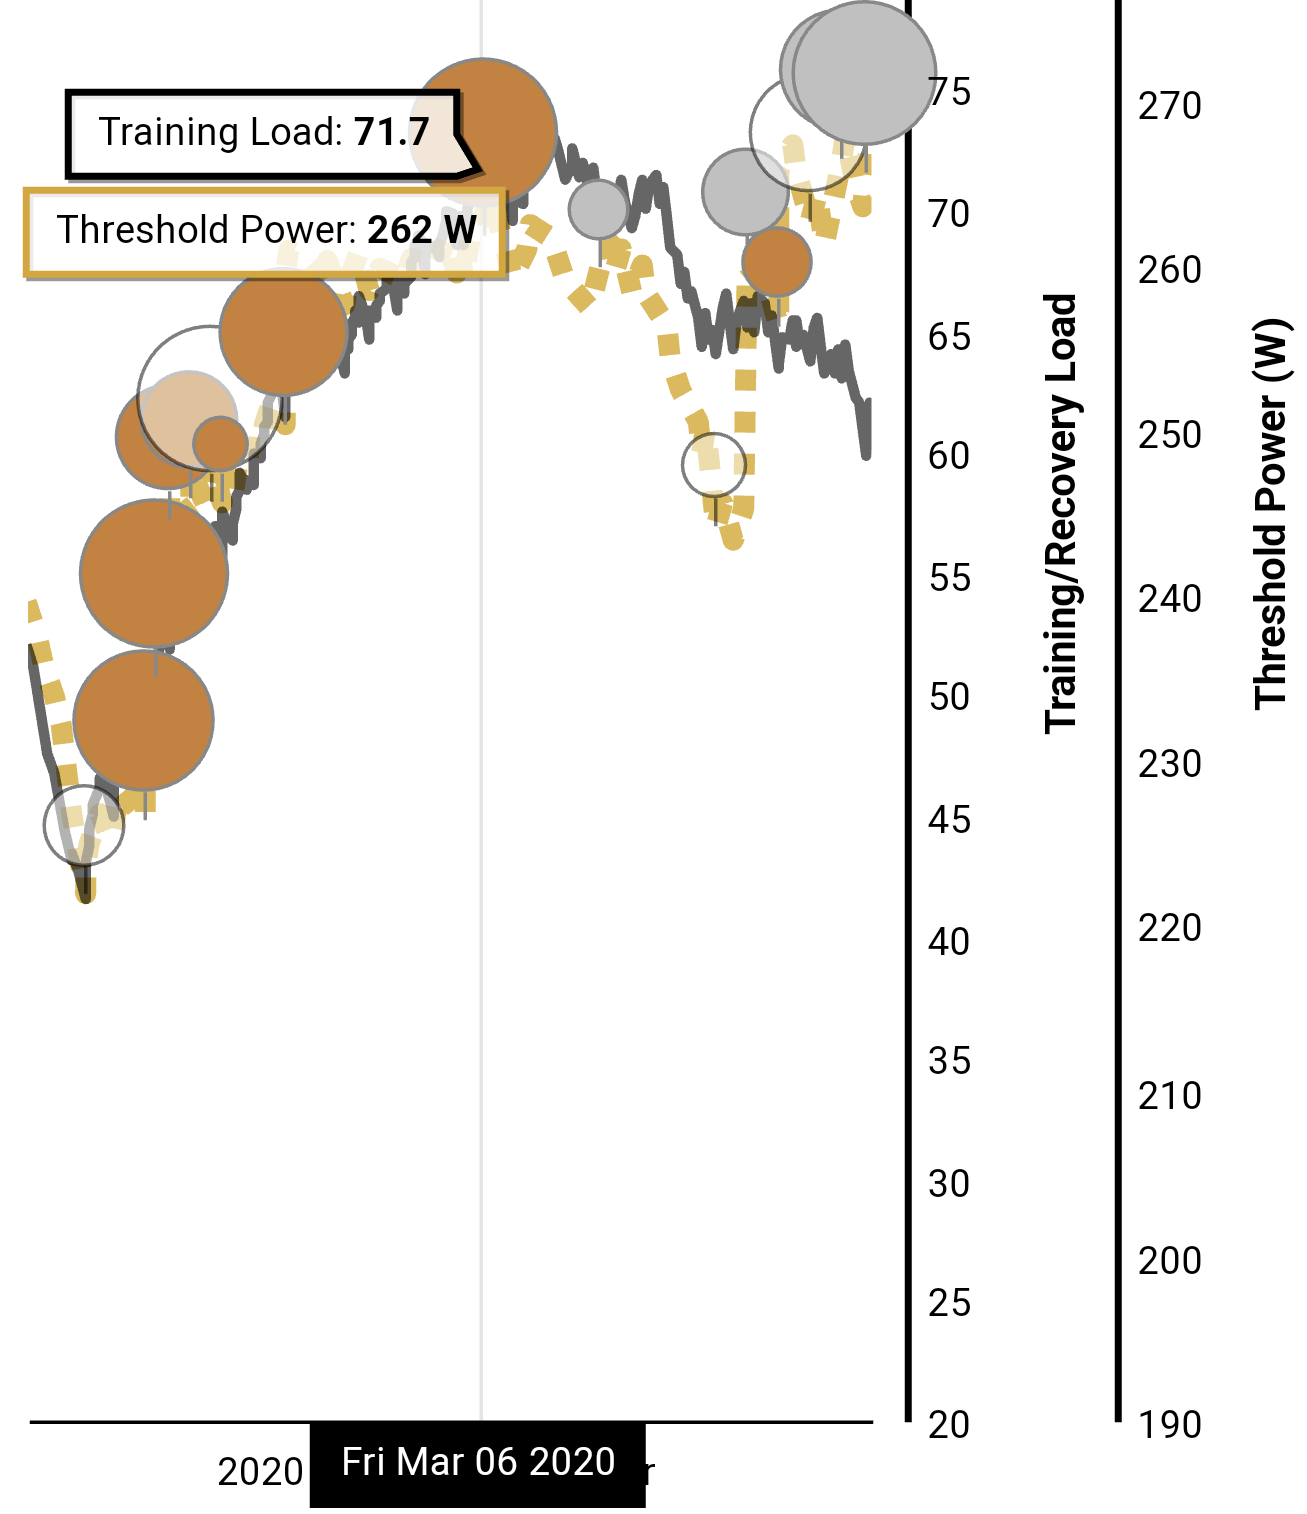
2nd peak in jun 2020 after volume reduced, but kept up the zwift racing:
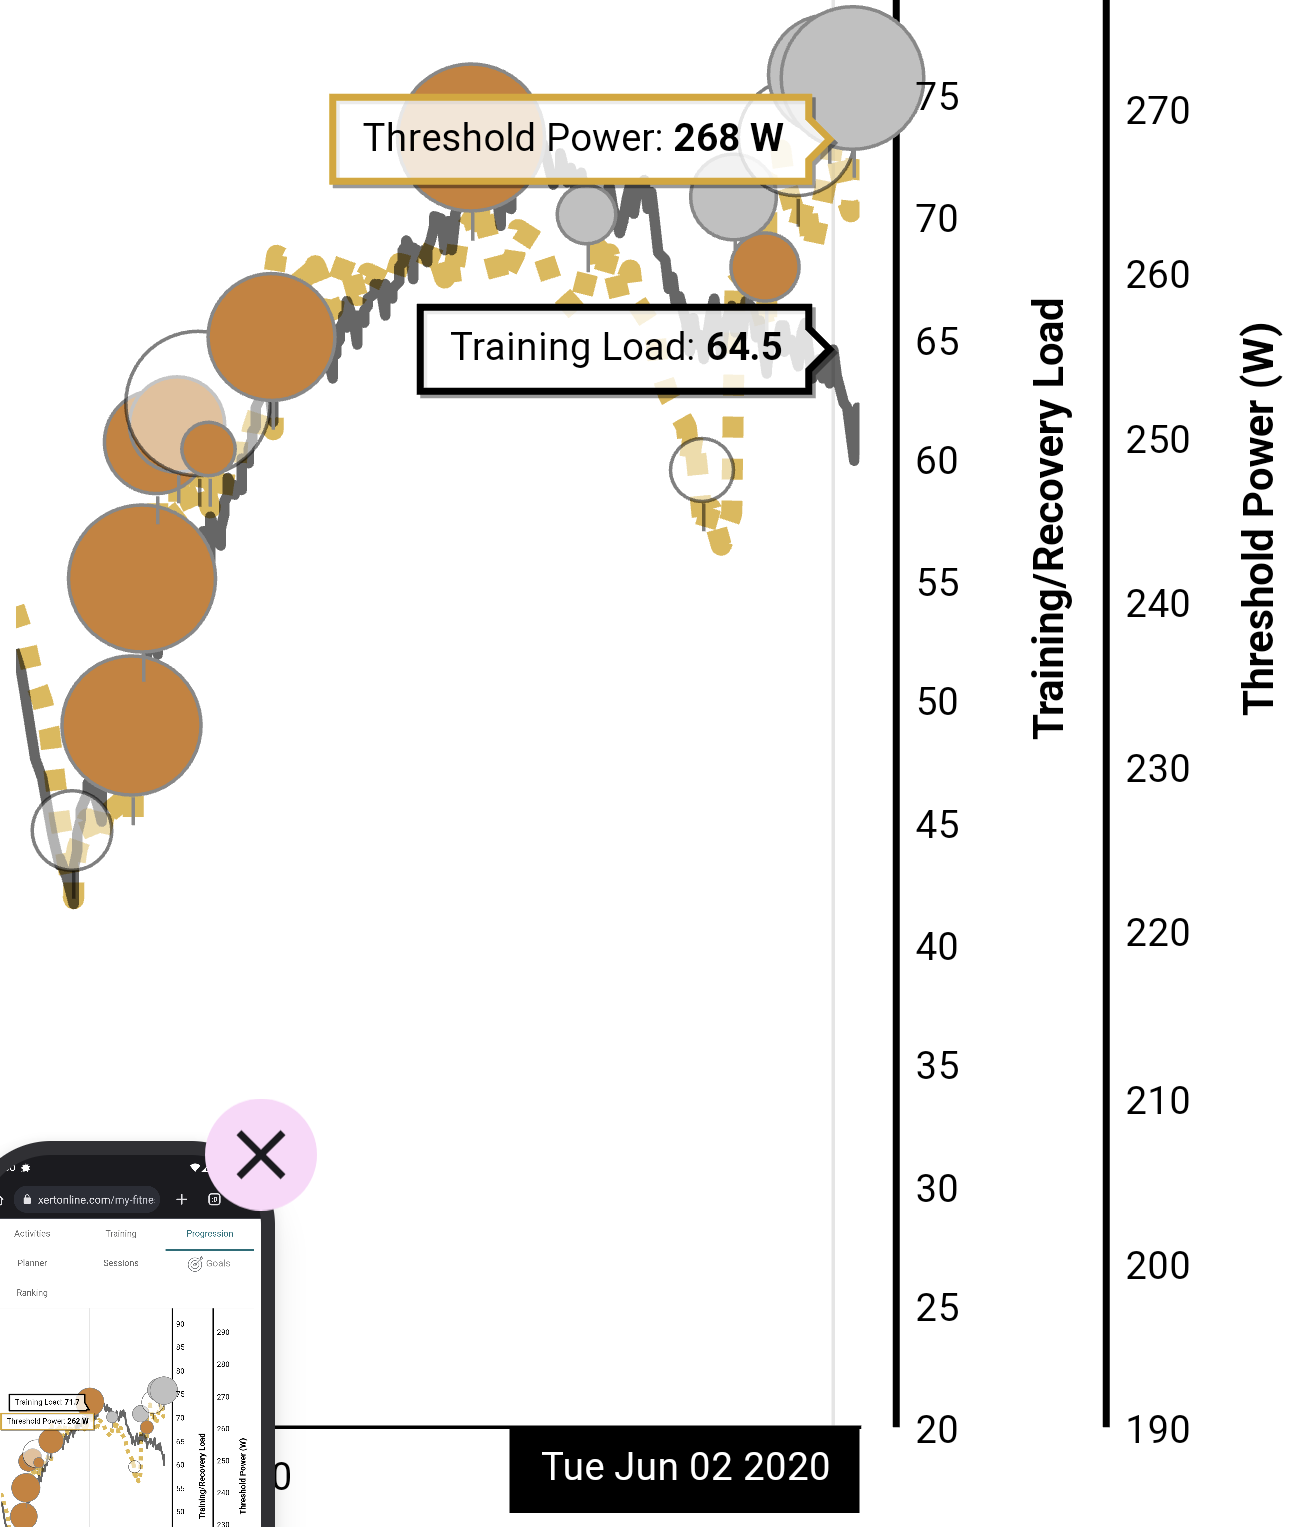
Oh, and long term, my TP has been in freefall ever since - but I think (hope?) that’s more correlated with the coincidental TL drop (kids, work, life etc) than is attributed to aging.
Sidenote: Scotts recent quest for 300w has inspired me on a similar journey to try hit my same peak TP/TL of 4 years ago (TL ~70, TP ~265w (~4 wkg)). I should know my findings in +6mth…
Jarrad
2 Likes
I found a correlation between Training load and TP in my kind of training.
TL 114
PP 919
HIE 21
TP 287
LTP 234
Weight 64 k
Age 48
The best way i found to improve my TP is increasing TL with a lot of low training low LTL since i have a lot of slow twitch i respond well to endurance training. I will simply what i have found.
1- Training below 10 hours per week TL below 80 TP around 250 watts
2-Training 10 to 15 hours per week, TL 110, TP 280
3 Training 15 to 20 hours per week TL 130, TP 300
4 When i training or riding more than 20 hours per week Training Load TL above 140 there is no response on more increase in TP . I think my maximum potential i have ever reached 310 watts TP
Again i do a lot of riding well below LTP, almost nothing above PP just a bit of HIE slightly above TP preferred long intervals focus climbing.
I hope it can help someone. I do not respond well to high intensity i think because i lack of fast twitch and i don’t train enough for them. My theory is nobody can’t do very well at both things (training) at same time Sprinting or Endurance, one or the other pick one.

Check out my activity on Strava: https://strava.app.link/MazxQCQjIyb
2 Likes
Impressive ![]()
Ive just woke up (in Scotland) but will look over your feedback and use it to help me as im also mainly slowtwitch - thanks.
1 Like
TL: 61 (60, 1.2, 0.2)
PP: 1165
HIE: 27.4
TP: 287
Weight: 74 (lots of cake and beers)
Age: 49
(Silver BT yesterday so numbers are fresh)
1 Like
I’ve added you to the spreadsheet ![]()
2 Likes
Impressive thread!!! Sorry for being AWOL here without commenting but looks like everyone is doing so well in identifying key aspects between TLs and fitness signature variables.
To explain a bit, Xert does a regression everytime you get a breakthrough between each system’s TL (low, high and peak) and the corresponding fitness signature variable (TP, HIE, PP) to establish the pattern of how each parameter goes up and down with training. For the vast majority of users we have, at any given moment, the relationship is linear and we can predict outcomes from it. As @Jarradk shows, the relationship is stark when viewed from a wide date range. But, again as he points out, on occasion, you might see some divergence. This is quite curious and what you should be thinking about is “why?”. How could my TP, for example, go up without any commensurate increase in training? Did I just magically get stronger? (Wouldn’t that be awesome!!!) There needs to be some explaination for it that isn’t captured in your XSS, bottom line.
Xert does a really good job of separating your low, high and peak XSS components and then using them individually towards low, high and peak TLs. So to say that there are different types of low TL, for example (something you’ll often hear when people talk of TSS since it doesn’t capture how different systems contribute to its calculation) could be an explanation. Perhaps these sub-sub components have a different time constant so can create greater day-to-day flunctuation in TP, for example.
Perhaps Recovery Load (RL) has some impact and allowing for a period of TL decline (aka taper) which enables RL to decrease significantly could also contribute to decoupling of a TL and a fitness parameter. I’ve seen this often enough to think there could be something here.
One thing to make note is that Xert isn’t doing what you’d expect it to do when it comes to establishing the linear relationship between a system’s TL and the corresponding signature variable. Xert has to handle everyone’s data, each with changing power meters, crappy readings, gaps in historical data collection, activity duplicates, etc. Combine that with users with sparse and very brief breakthroughs. It’s a tall order for a system to handle everyone’s data without having to do some manual data cleansing or correction.
To help avoid having to manually intervene, Xert by defauilt uses optimal decay which in essense is a decoupling of your fitness signature variables and their TL’s downwards in order to address overshoots in your signature caused by wonky data or other misreadings. Without it, if you get an error in overreading your fitness signature, it would never correct itself - why when using No Decay things need to be monitored carefully. So the decay method helps in correcting and finding signature changes in the presence of errors.
The drawback to having a decay, is that some breakthroughs aren’t really full breakthroughs and the regression between TLs and signature variables can get thrown off. Add to this, errors/gaps/duplicates things get more challenging. Imagine if you went 2 months without a power meter but continued to ride as normal. Your TL would tank but the moment your power data came back you got a breakthrough and Xert would think “Wow, you got this signature with a very low TL. You must be very responslive to even the smallest of training loads”.
So keep an eye out for how things work for you and if you see some decoupling, ask why. Is there something wrong or something right that you should be looking to address/exploit to get your fitness to improve outside of just standard increases in your training.
8 Likes