Shout out fro the Buckets feature

No and I don’t think Xert would say that either… they are XSS buckets not time in zone buckets… if you are not fully recovering between efforts in the 30/20 you will accumulate XSS at a higher rate later in the set…

I think a different version of your question is an interesting one i.e. is getting 10 high XSS from 30/20s ‘the same’ as 10 high XSS from however many 30s efforts with full recovery in between are needed, and I’m not sure anyone knows…? In Xert’s modeling it is the same, but am not sure we know in a physiological sense or in the real world.

I also think some of the ‘old world’ training workouts add value which is not captured by the buckets approach eg if you need to be able do 20 minute climbs just below threshold it’s probably a good idea to train long-ish sub-threshold efforts so you can handle the difficulty… no way chunking (sub) threshold efforts into 20 one-minute intervals with full recovery is the same as 20 minutes at threshold… same can be said for repeatability in case your event simply doesn’t allow full recovery…

That said, I do see value in the buckets approach for HIT workouts outside, purely because of the challenge of structured HIT outdoors…, finding a route / terrain… And even if you have a good hill, who really wants to do repeats of the same hill (not to mention how it looks on Strava :wink:) vs a nice loop with various length hills

7 Likes


4 different sets totalling 5 minutes @ 5 minute power showing the different High & Peak XSS

So here’s an interesting exercise (I tried to explain this in the podcast with Jack Burke but it didn’t come out as clearly as I had intended.)

Compare the XSS from 2 efforts:

  1. 20 minutes at your 20 minute power
  2. 40 minutes of riding with 1 minute at 20 minute power and 1 minute off. Totals 20 minutes of total time at 20 minute power.

Which has more XSS? Which one should have more XSS? Think about it first before scrolling below to get the explanation.

Let’s model this in the workout designer. Here’s a 20 minute effort at 20 minute power:

Note the XSS values. 72 total 4.5 of high XSS for this (my) signature.

Now lets see #2:

37 Total. 2.3 High XSS. Makes sense right? Doing 20 minutes to failure should be worth a lot more strain than 20 minutes of 20 minute mmp without much fatigue. Xert computes this and it makes perfect sense.

Aside: Now you should actually try this same exercise with TSS. Do it. It’ll make no sense. It gives more TSS to the easy one. Substantially more because the effort is 40 minutes long vs 20 minutes long. It doesn’t know about fatigue and substitutes duration as a proxy for it. It’s no wonder athletes need a coach to help them use it correctly.

Back to XSS… To get the same XSS of a 20 minute effort to failure doing 1 minute on and 1 minute off would require just under 1:20 minutes (twice the 40 minute bout). that’s a lot of intervals but Xert would equate these. Are they equal? We can’t say for sure but it does make logical sense. If we add up your historical XSS values by low, high and peak done in any way using an exponentially weighted moving average, do they predict outcomes? If so, one could argue that XSS measured this way is sufficiently correct to use for training prescription and the various ways it could be performed aren’t materially different. Is it perfect for everyone? Not always so there’s is noise and there is also confounds in how XSS works that we could improve. We working on these actually. As it stands, it’s probably a bit better than just pretty good. It is far, far better than anything else and likely far better than any one person’s intuition on whether one workout does more or less than another without any knowledge of XSS.

6 Likes

Thanks @xertedbrain, got it, and that’s similar to what I meant earlier in my post re the 30/20s (limited recovery) vs 30s repeats throughout a ride with full recovery… Xert is definitely better quantifying strain above threshold.

The reference you quoted was actually about sub-threshold though, which I think isn’t captured (today / until Xert 2.0) since you are not drawing down MPA or capturing fatigue below threshold… the principle feels the same as your example (longer continuous = harder), but so far it’s modeled differently it gives the same XSS

1 Like

From a sub threshold standpoint, there are a couple of ways to improve things that we’re considering in 2.0:

  1. The range between LT1 and TP gets split into low and high XSS.
  2. We introduce a 4th signature variable.

What would these imply to your training?

For option 1, it would mean that you get credit for some high intensity strain betwen LT1 and TP. This seems to makes sense but is not likely to make a huge difference to your training and results. Here’s why: the main implication is that some of the xss spent in sweetspot/Z3 would go to high intensity, After a long sweetspot training effort, it could mean that you’ll require more day-to-day rest. In the current model, you’d see a blue day the next day when it would be yellow in the 2.0 model … or not. And the reason it may not make that big of a difference is that you had been counting some of this toward high xss previously, you would have accumulateed more high training load as a result and so can handle more high XSS. In effect, all you do is to shift some xss from low to high apply a different time constant to a portion of that range between LT1 and TP. So in the end, it might not be as dramatic and important as one might think. It’d be better though and likely align better with physiological responses. There a number of other advantages to our model that I’ll leave for another time.

For option 2, things get really tricky since we’d need to now say that there is a 4th dimension. We would attribute this region betwen LT1 and TP (or a portion of it) to a new fitness variable. The question is “what part of your power duration durve is affected?”. Maybe it’s not part of the power duration curve and it is something else. In the end though, it would still need to affect MPA in some way and this would need to reveal itself when you do MPA analysis on the data. If something doesn’t affect MPA, then it’s not something that affects performance and thus isn’t something that will change things if it’s trained. Things I’m considering are second order affects like changes in capacities, for example. But we have a model for the affect of HIE and TP over longer rides already in 2.0. So the identification and ability to quantify a new dimension remains a bit elusive, especially when we also include the improvements from implementing option 1 above, adding a new dimension will be fraught with a lot of challenges.

To summarize, I don’t think there is much being lost in the current model from accounting all xss betow TP to low XSS. There could be minor differences in performance outcomes if the vast majority of training time is spent training in this zone. You’ll likely need to take more rest days than what’s shown so any possible acceleration in gains (if any) would be attenuated anyway.

3 Likes

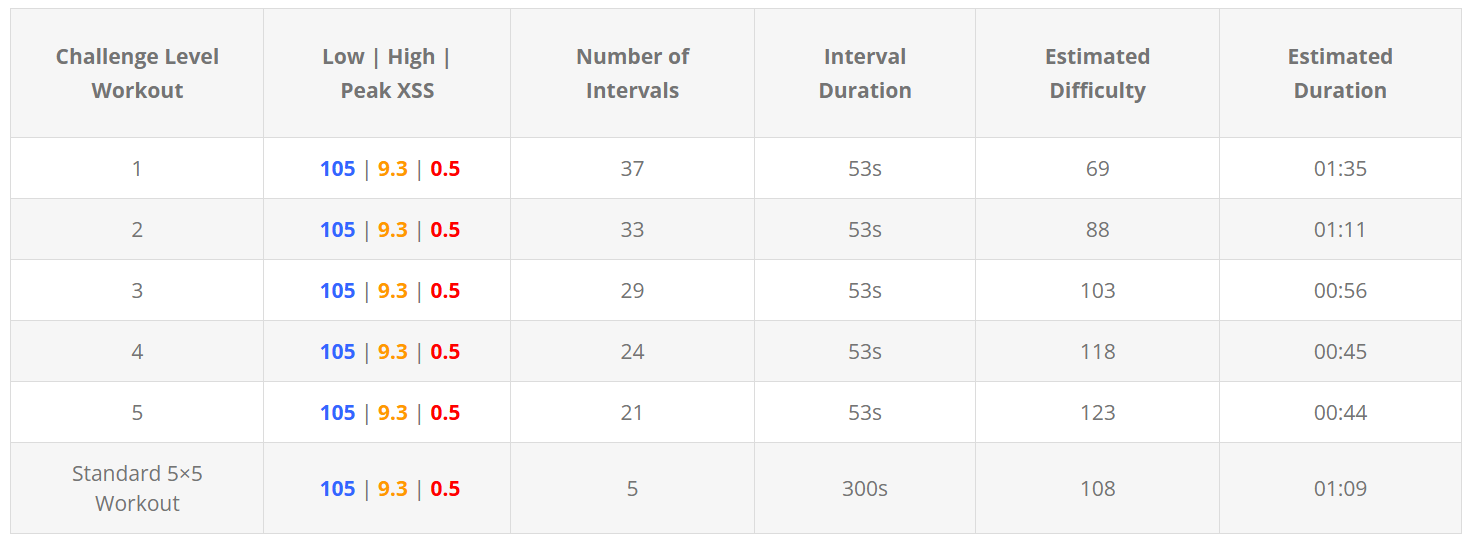
Here’s some interesting information we’re adding to the blog post on Magic Buckets that I thought I’d share here for this discussion. In the new data field, we introduce the concept of Challenge Level which show on the data field and range from 0 to 10 - 0 being no fatigue and 10 being a breakthrough. Doing a workout at Challenge Level 5 means you’re doing intervals around midway between no fatigue and a breakthrough for the high intensity power prescribed by the XSS targets. The main point I wanted to share is that, as you do workout with greater fatigue, the faster you accumulate XSS and the less training time you need. In effect, workouts become more efficient and you can reach higher levels of fitness within a given time constrained plan. But if you have time and are not motivated to go really deep, you can do more and spend more time at it. Here we compare doing them at different levels with a typical 5x5 VO2 workout done at 115% of FTP.

2 Likes

Whilst there is a distinct break at TP ie you fatigue a lot faster above it than you do below it , there is no such large distinction at LTP making it, I assume very difficult to model accurately. If it’s not modelled accurately its just guessing.
However the advice you give in the planner really covers it
" You’re going focus on improving your aerobic power. You should look to maintain efforts near your Lower Threshold Power.

Zone: 2 - Endurance. Target Interval Power: 163.1 watts."

Thanks for the detailed response

Perhaps it’s similar (or the same) as 1. but another option is to stick with 3 parameters but replace TP with LTP… below LTP is sustainable ‘indefinitely’ while above leads to some fatigue over time… rather slowly depleting MPA between LTP and TP and then accelerating above TP as today… no idea whether the math works as ‘simply’ or elegantly as the current model though!

Maybe depends if you believe the story that there is a ‘sweet spot” which optimises the trade off between adaptations and recovery :wink: but I understand the point. In all seriousness it would be cool to be able to really figure out that trade-off or optimization below TP… for now it’s trial and error / just figuring out how much low intensity (below TP) work you can recover from.

Looking forward to 2.0 though understand the challenges and other priorities - already loads of innovative developments recently :+1:

4 Likes

What about where the riders Fat and carb ratio is 1:1/lactate balance point? That would allow for Steve Neal type tempo intervals to be gauged more accurately. But would XERT 2.0 be able to predict the lactate balance point accurately enough to be of any use?

There are some new values coming out of the math so we’ll have to see. Balance point is a lactate value that Steve uses for training purposes and uses lactate testing for calculating it’s value.

1 Like

Here’s another reason Slope mode works better than ERG Control. :slight_smile:
You can eliminate any trainer response issues during transitions because you’re in charge of start/end of each interval. Not only can I more accurately attain targets and durations (improve compliance), but I can exceed target watts or duration if needed.
Where this becomes most obvious is with short burst intervals.

I recently did this workout in AUTO instead of Slope because I wasn’t too keen about monitoring the rainbow gauge on the Session Player or EBC for the endless series of bursts. Instead I closed my eyes for a portion of each set. :smiley: However, look what happened during those two sets when I display Target Watts for the completed activity.

First set –

Second set –


As a result I substantially undershot the high/peak targets for the day. That also means I did not achieve the 4-diamond Difficulty target (Tough - 122). The highest I reached was 107 (Difficult - 3-1/2 diamonds).
I was aware of this while it was happening but elected to stick with AUTO to see the results.

MissedXSStargets

I’m positive I could have gotten a LOT closer in Slope mode monitoring the rainbow gauge for 40+ reps per set. Challenging no doubt, but doable. :smiley:
Compare that result to this set in a previous HIT workout where I am controlling the resistance in Slope mode for every interval.

CloseXSStargets

I was short on High because I rested some in the middle of the workout and didn’t elect to make up the difference during my extended cooldown. The effort was good enough for :white_check_mark:'s but I could have done better by observing Buckets.

What would be ideal is if the next version of EBC includes Buckets so you always know where you’re at during a workout and how close you are to the low/high/peak goal.
Or an indicator that tracks your compliance to target in real-time. For example, as each interval ends there is a compliance gauge to indicate if you were short/over the strain target for the completed interval. Could be a simple line gauge like this —o— where a black dot in the middle means you were spot on.

Tried Magic Buckets for the first time today, pretty cool stuff @xertedbrain! Lots to learn still.

The Training Program I have chosen is Continuous Improvement, Breakaway Specialist.

My question is:

Today was a dedicated endurance ride on Zwift. I ride with my Garmin Edge running as well with the Xert Magic Buckets page. The buckets screen today was the Magic Intervals interface (I imagine as it follows the plan by Xert) but I would have preferred the Magic Endurance interface.

Do I accomplish this (seeing the Magic Endurance Interface on the Garmin device) by selecting an endurance ride in the Training Tab before firing up the Garmin edge? Also with the Magic Intervals interface is there any way to see HR data?

Thanks again Armando!

Yes. Magic Buckets grabs the XSS goal and Focus for the day as indicated on the Training page.
This is based on whatever workout is selected so if HIT was recommended today and you switched to Lucy, Buckets will reflect the switch from HIT to LIT.
You’ll also see HR in upper right when the Magic Endurance screen is displayed.

1 Like

After I got my new 1040 which I use outside I started using my old 1030 inside.

As well as loading the Magic Buckets field on both Garmin’s do I have to register them both as well
Thanks

Yes. Each device needs to be registered.

2 Likes

Yup. Just plan your training beforehand.

1 Like

I’m not sure if I’m missing somethng. I agree with you Armando, 20 X 1’
is less fatiguing. I modeled 20 X 1’ and 1 X 20’ in TP and got very similar TSS.

TP does see the work as the same, as it should, and see the IF as much less, hence less fatiguing for the worjkout duration. Am I seeing things incorrectly. Trying to understand you statement about comparative TSS, that’s all about .

The “easier” workout gave you 44 TSS. The 20 min all-out effort gave you 37 TSS. So you get less credit for a harder workout? Doesn’t make sense to me anyways! :slight_smile:

Looking only at work or time in zones doesn’t work since it doesn’t account for work done under fatigue - e.g. when your MPA is lower. Similarly, NP doesn’t give you any indication of how much hard riding was done under fatigue, therefore IF can’t either, since it’s just a ratio of NP to FTP. Funny enough, we have a workout specifically designed to “game” normalized power as high as you can in a single activity - it’s a potent one for building your HIE if you ever want to give it a try! :smiley:

Because I’m a curious individual, I did the same exercise with one 20 min effort fresh to failure & 20x 1 min at 20 min power w/ 1 min resting recovery. To make it more relatable, I also threw in a 10 min warmup at 50% TP & 5 min CD at 50% TP. If you’re keen to dig into it more, you can check out my detailed analysis below:

More Details

For all-out 20 min effort Xert gives me 85 ( 80.3 | 4.5 | 0.1) XSS in 35 minutes, while old methods give me 51 TSS:


But if I split this into 20, 1 min intervals with 1 min rest between, my workout is now 55 minutes (20 min longer) and Xert now gives me only 48 ( 45.5 | 2.3 | 0.1 ) XSS, while older methods now give me more TSS… 54 TSS now:

Interestingly to get the same (roughly similar) XSS by doing the 1 min on, 1 min off pattern, I needed to DOUBLE the repeats to 40. This workout would now give me the same XSS as the 20 min all-out effort, but now takes a whopping 1 hour, 35 minutes. Again, older methods rate this workout as being the “best” of all options so far, coming in at 99 TSS!

2 Likes

Was it intentional to remove the green checks, orange, and red marks in the new “magic buckets”? I found those useful to help me know when I had done “enough” and also when I had got to that point of “too much”. It was somewhat satisfying to hear that single ding when pushing hard that let me know I had hit the peak target.