I had 2 BT activities in a row. The first one resulted in PP going from 894 to 891, but the second one (2 days later) bumped up my PP from 915 to 934. Why would it jump from 891 to 915 between rides?
Thanks!
1 Like
Hi Simon,
Great question! This is related to the signature decay method. In addition to getting a bump in fitness directly as a result of the BT, Xert also bumps up signature parameters a little based on accumulated strain. If you look right after a ride is uploaded, you’ll notice that TP will get bumped up when Low XSS is accumulated, HIE bumped up with High XSS, and Peak Power will get bumped up with Peak XSS. The bumps are usually fairly minimal (and they usually decay away by the time of the next activity). This is to help keep a more consistent signature during periods where you’re not pushing for Breakthroughs, but are still consistently training.
Hope that makes sense!
2 Likes
Makes sense, though some of the jumps are more then minimal. Overall PP (as well as TP and HIE) seem to fluctuate quite a bit more, and more rapidly that I would expect. I understand the higher rate of change when you are starting or if you missed a couple of weeks of training, but once you accumulate a few months of data, and you have 4-6 activities per week, shouldn’t the rate of change for signature be very gradual? I’m thinking sub 1% per change…
1 Like
You’re correct, HIE and PP are more volatile, if you will. This is represented in the shorter time constants for HIE and PP, compared to TP. This is consistent with the research literature, which shows that HIIT can consistently increase performance in a short amount of time (most research studies are 4-6 weeks).
However, as you continue building your High/Peak training loads, you’ll find it difficult to continue building them (fatigue will get in the way). So you’ll find that you can increase HIE/PP rather quickly in the short term, but like you said, these improvements likely won’t continue forever.
This is why the XATA will encourage endurance workouts during the base/early build phases, and save the High Intensity training for closer to your target event.
Hope that makes sense!
2 Likes
@ManofSteele - your explanations make sense (Thank you!), but what I see in metrics - not really. As long as I flag all my outdoor rides, my metrics are exactly where I expect them to be, but if I don’t, metrics go completely haywire, moving rapidly and seemingly random. But that wouldn’t work for me, with spring coming (can’t wait!) and most of my activities will be outdoor rides. It should be a way to weight outdoor rides so that they don’t impact metrics/signature as much. Is this something that could be done now? May be measure randomness of activity and assign weight to activity impact on metrics reversely proportional to randomness? Shouldn’t be that difficult mathematically, right?
2 Likes
The assumption is that even if you’re doing High/Peak strain on your outdoor rides, eventually your high/peak TL’s will plateau out, and with that, the decreases in the bumps to HIE/PP.
The bumps are made relative to each parameters’ respective training load.
I don’t think this assumption works. When I loaded 8 months worth of data with a lot of free rides, my metrics were completely out of wack. Instead of plateauing, XPMC chart was showing wild swings in HEI, PP and TP with every ride, and practically ignoring workouts that felt a lot harder than rides. Trying to flag/edit some of the activities to make it look reasonable felt like trying to squeeze a water balloon. I ended up dumping all of the data and reloading only last couple of months with mostly workouts, and still had to edit or flag my outdoor rides. Now the metrics look good, but to keep doing it manually doesn’t seem to be a good approach, especially with more group rides coming up.
It is not just by feel - in about 6 months or unstructured “difficult” riding with BT on almost every other ride, my real FTP practically didn’t change and may be even slightly declined. (yet according to Exert it went all the way to what I can sustain for about 6-7 mins max) Within last 2-3 months, doing workouts that’s according to Xert were “easy” and so much less strain than rides that they barely registered on XMPC, my FTP went up from 235 to about 255.
So, something is definitely wrong with the way rides with a couple of short, hard efforts, but also a lot of coasting, stopping, etc. influence metrics significantly more than very productive and consistent workouts.
This seems related to your other posts, and see over there that some changes were made to your signature - did that improve things / are you still having issues since then? If you’ve not tried riding hard outside again since, maybe give that a go first.
You shouldn’t have to flag rides (apart from true exceptional data issues) to get an accurate signature, so something is still not right if you still see wild numbers after riding outside (starting with an accurate signature)
You said that power meters indoor and outdoor were similar… does that mean on average, or also at all points in time / accounting for power spikes? Similar meaning 1 to 2% difference, or more?
If anything, outdoor riding should be easier on average or per hour, due to the coasting and stop/start you mention. That said, it wouldn’t be unusual for a hard outdoor effort to result in slightly higher numbers for a range of reasons… but that doesn’t sound like your issue here
Just brainstorming / trying to help as I don’t have similar issues, and haven’t heard of many that do
As I mentioned, I ended up dumping data and reloading just last couple of months from Strava.
I had couple of typical rides last week with some short hard efforts. Resulted in gold and silver BTs and it again bumped up my TP to unsustainable level, so I had to edit activities and undo TP changes.
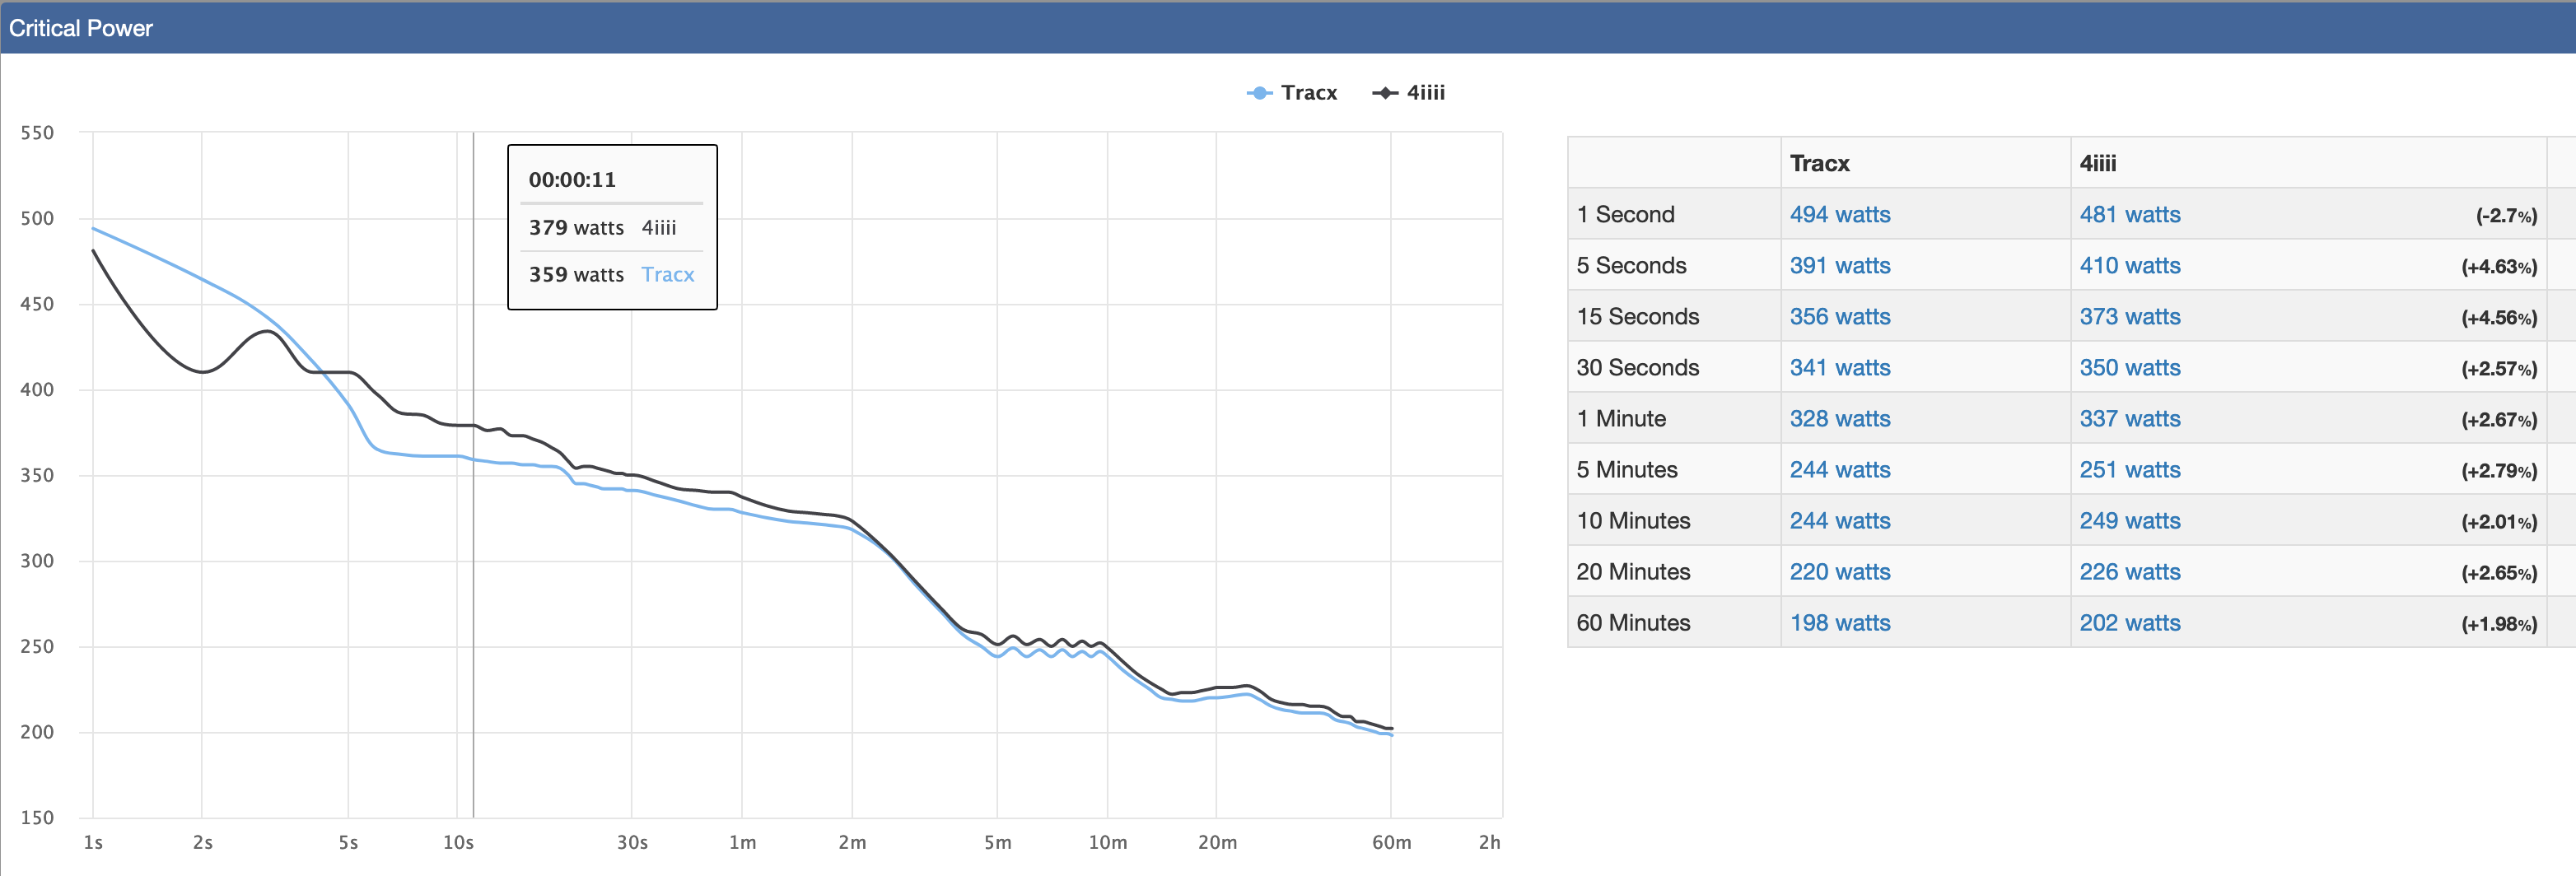
I just did another powermeter test and the differences are much higher then I remember. On average, it’s close enough, but crank-based data is A LOT more spiky, which actually makes sense - power fluctuation from motor in a rear hub must be a lot smoother than crank strain gauge that is a lot more sensitive and has no inertia.
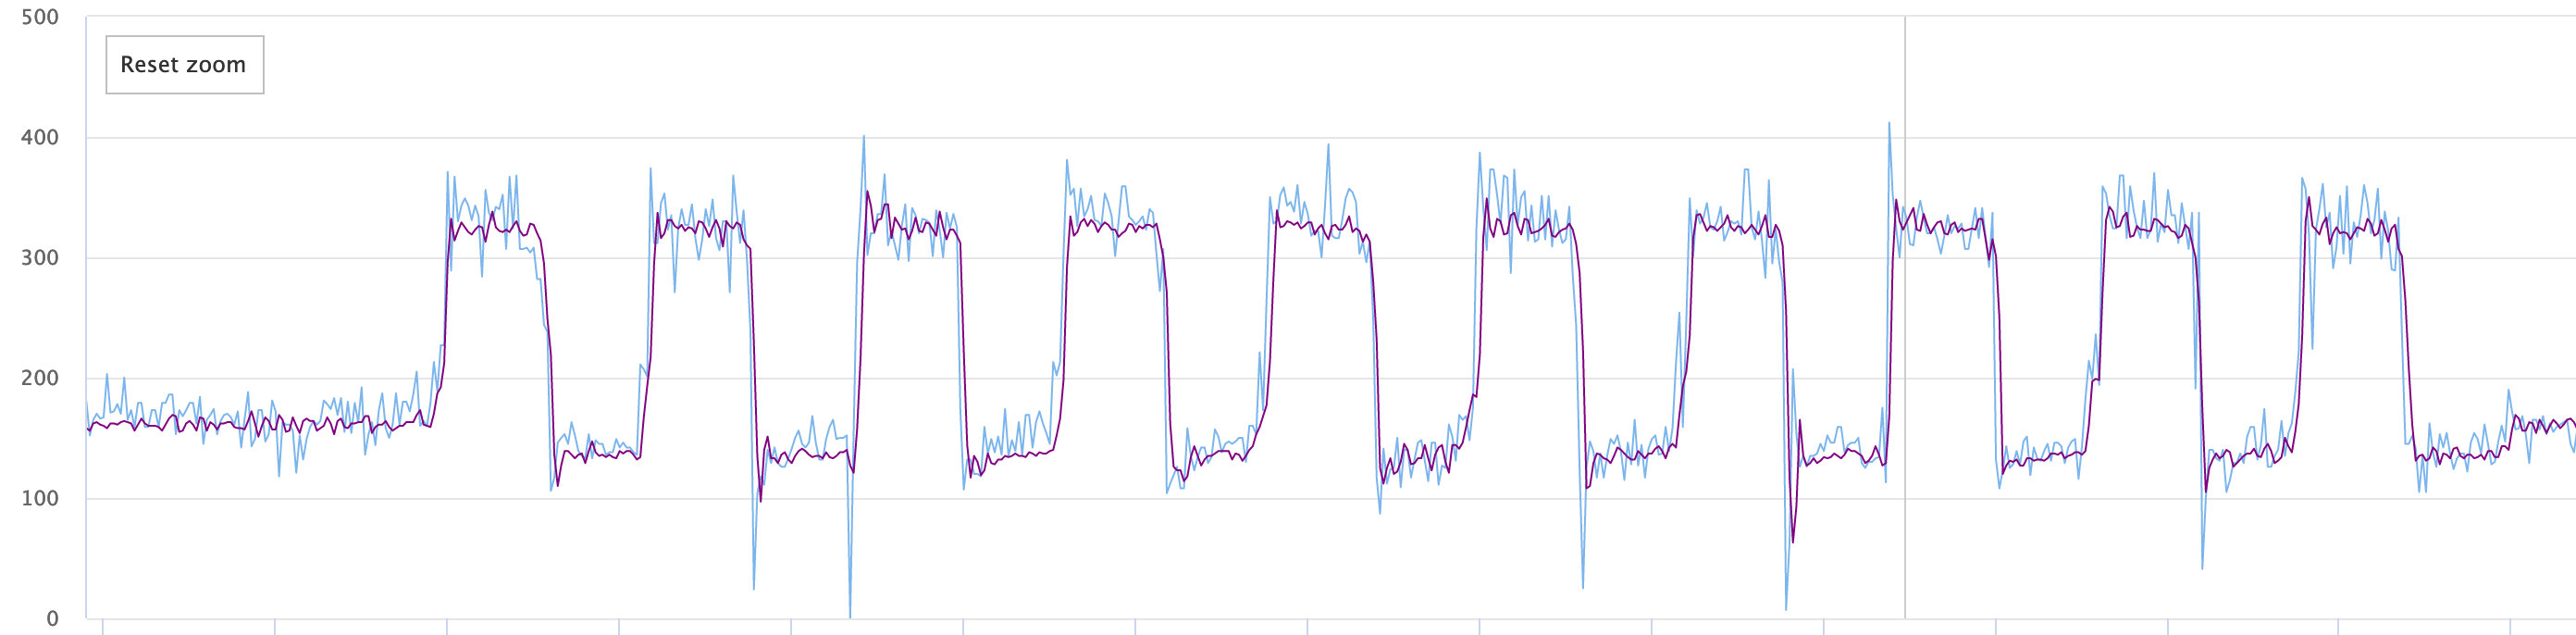
This might be a contributing factor, but i strongly doubt it is the main reason for erratic metrics from rides.
Do you see wide variations in signature values from one day to the next when you view the Activities table?
Or are you referring to the squiggly lines for PP, TP and HIE when the Progression chart is set to Fitness Signature?
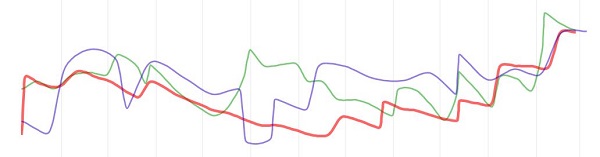
Both. Signature values jump by a lot from one activity to the next AND consequently both XPMC and signature lines VERY squiggly. I can’t show it now as I deleted the data. With mostly workout data now, lines are obviously not straight, but not crazy either. I think the system can’t properly analyze rides with very high variability of power. Something like this:
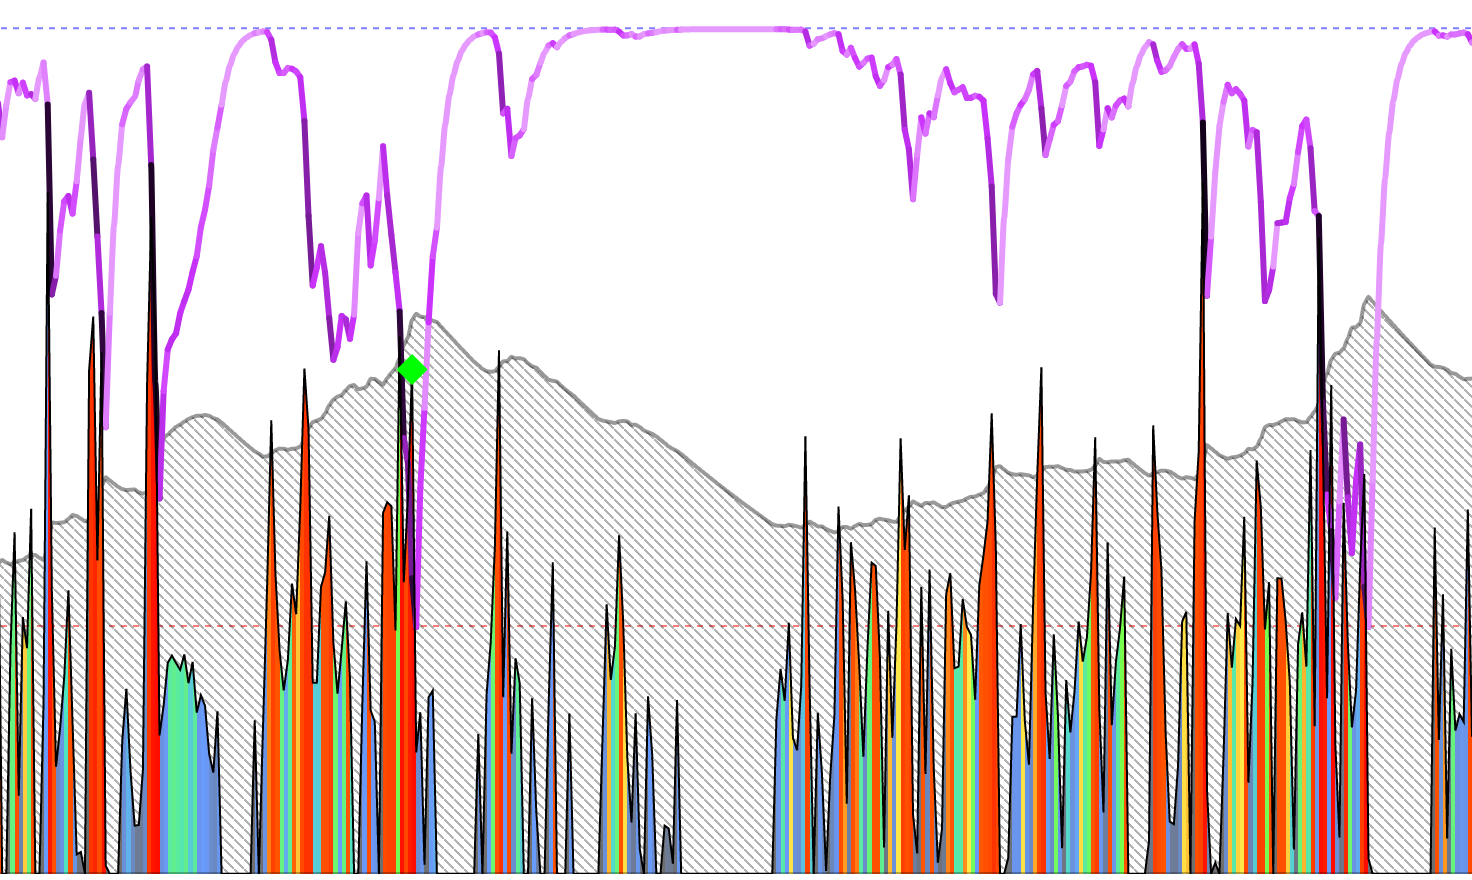
This wasn’t even a particularly hard ride, but it affected my signature by A LOT more than any workout that I had to push myself very hard to complete.
I’ve found Xert to work very well for high power efforts, even if highly variable… if the power readings are correct, that is.
From your powermeter comparison it looks like the crank based one reads quite a bit higher at higher power (10 to 20w from 5s to 2m) which could have a big impact on MPA drawdown… and they weren’t actually high power efforts compared to your outdoor rides… can you do a test with high power and variable efforts like you do outdoors?
And not sure if you have dual sided or single sided 4iiii, which could be another factor
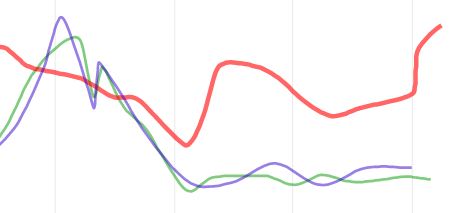
That looks like a normal spiky outdoor ride profile except MPA seems too low to have been pulled down that far especially if it was not “a particularly hard ride”.
Were you deliberately jumping or surging during those red spikes or just riding along?
MPA too low would explain frequent BTs.
What do others think?
Reference: Breaking Through the Xert Way! – Xert (baronbiosys.com)
Examples: Let’s See Some Recent BT’s - General - Xert Community Forum (xertonline.com)
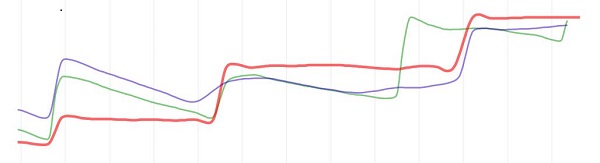
For comparison purposes here are some of my Fitness Signature progression charts. These will vary considerably between individuals but the patterns should be similar.
This one is me moving from Base in Dec through Build (as of today) with a TED set in April – riding exclusively indoors so far.
Here’s what it looks like when I set filter to Year –
That includes some gaps off the bike and floating between July and November (no progressive TL configured).
I only have a few activities flagged from outdoor rides with unusual power spikes. (I have a Stages left crank meter.)
Here’s mine showing me peaking outdoors in July 2019 (TED was August) then tapering off and riding mostly indoors during 2020 through today.
Notice the big difference in PP outdoors versus indoors. A major factor is the inability to sprint indoors like you can outdoors. My data is also skewed by some health issues but that’s another story. 
Are these lines and patterns similar to yours?
Not sure how it works on other trainers, but at least on Neo, it take 5 sec or so to go from 0 to let’s say 400W, where with strain gauge on crank it’s instant. I don’t think I can produce same kind of variability on a trainer.
It’s a left side only, but if anything it should lower power a bit - my right leg is stronger then left (after I broke my left leg a few years ago)
I live in the area with a lot of small climbs/rollers. It’s hard to find a flat route - you go either up or down 80% of the time, and I like to go hard on climbs.
I don’t have my charts from were I had all the data. But it looked more jagged.
With mostly workouts it looks fine (not as good of a progression as yours - good job!)
Interesting - I rode relatively hard ride today - 50miles/3800ft climbing with quite a few PRs on climbs. And the results in Xert were exactly what I would expect - near BT, and only very small changes in signature. This is night and day from what I’ve seen before. The only difference I can think of is that I forgot to turn on auto-pause. It significantly lowered my ave speed -13.7. (It would be close to 17 with auto-pause on). Unless it’s my whining that made Xert team to adjust something in algorithm, I might’ve found the problem. I will do another ride with autopause on tomorrow and see how it compares.
Hey Simon,
Power meters with greater fluctuation tend to create higher signatures when those errors happen during the breakthrough itself. In addition, longer efforts around TP will tend to skew numbers higher too. This is due to the fact that power above threshold isn’t equally balanced with power below threshold. This fatigue/recovery conundrum is the reason why sustained efforts with small stoppages tend to underestimate the true fitness capability of the athlete.
1 Like
Autopause isn’t material since the system will fill in the pauses before analysis.
1 Like
Not necessarily errors. Strain gauges can register rapid increase in forces that last a very short time.
That would probably explain the wild signature swings I have seen. Wouldn’t it make sense then to discount / assign lower weight to results from rides with very high power variability, so they don’t mess up signatures?
Great idea but would have to determine how to establish whether variability is real or not. Could be done but likely a somewhat more of a “project” rather than a simple thing to do.