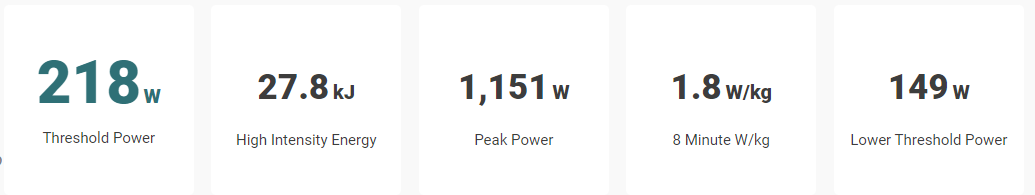
But the PP is accurate. What does that mean? Is that normal for beginners or does overweight people have naturally higher PP than even average athletics – or are the other signatures not plausible at all?
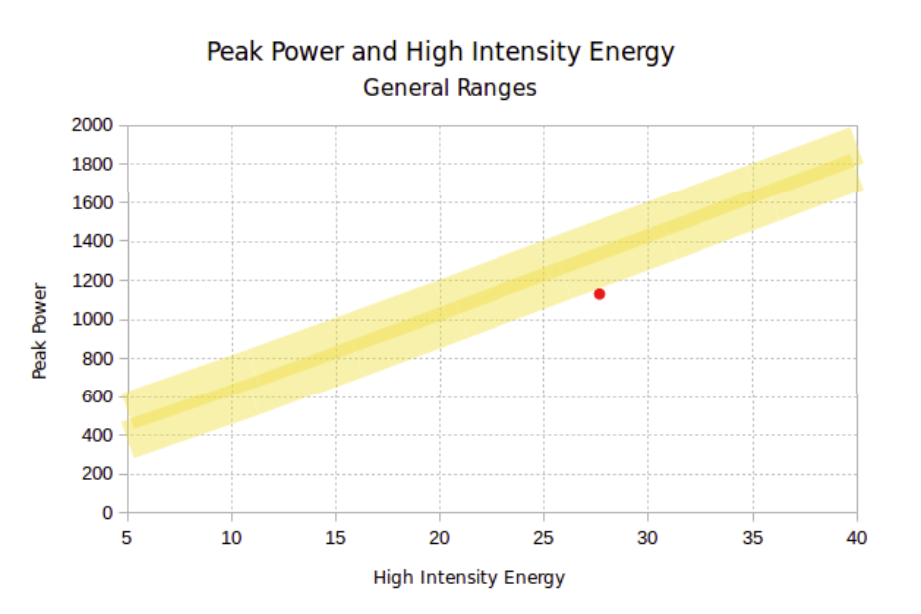
There is a chart to roughly check your signature, as well as a Xert ratio to give a rough check of your signature and I think it’s broadly ok.
The shape of the ranking spider is partly driven by the fact that some athlete types are expressed in w/kg (which disadvantage heavier riders), while others are in absolute watts.
For signature accuracy it’s a good idea to have different types of breakthroughs, from the very short sprints out to 10 minute or so efforts (not that it needs to be a steady 10 minutes, but ideally drawing MPA down over a longer time and keeping it low as long as you can, rather than 10 minutes with a small MPA drawdown followed by a sprint)
The red dot is my PP/HIE. So maybe HIE is fairly overestimated and TP underestimated?
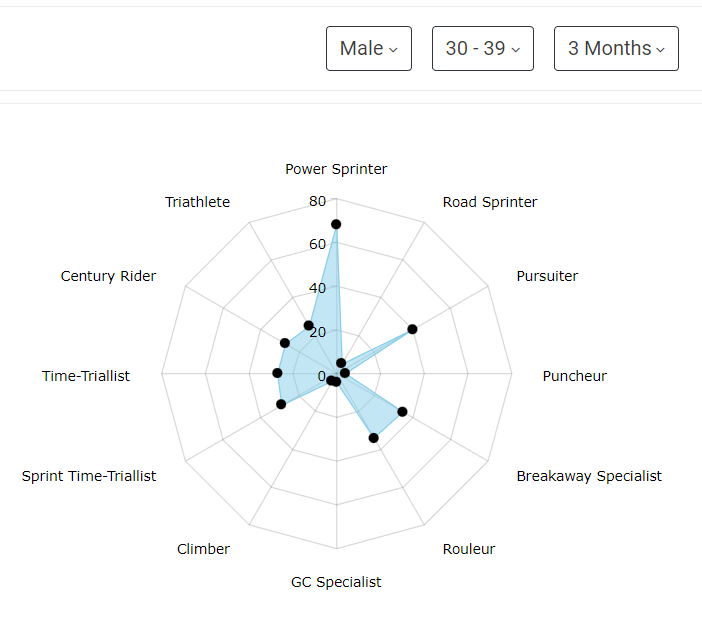
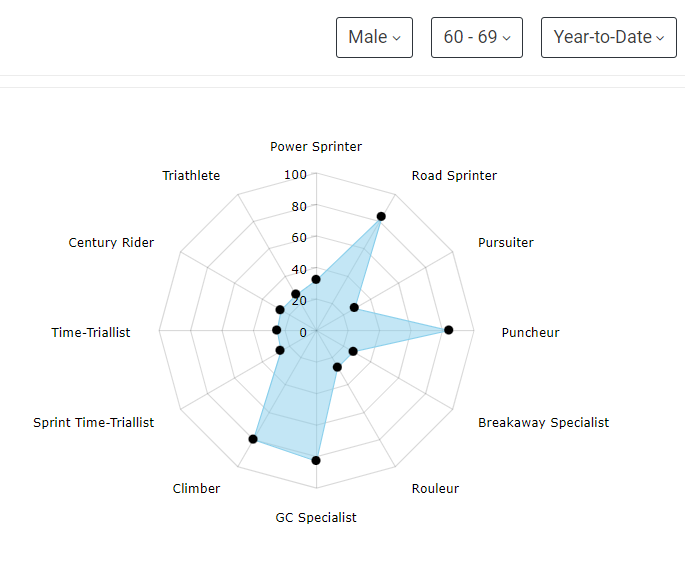
Of course I understand that some types are expressed in w/kg and so they are very low in comparison. But look at even all the ones which are absolute: all of them are below 40%, most even below 30%. But only “power sprinter” is way above 60%.
The difference just seems too much – or is it normal/still plausible?
as Wes says variety I have a workout that is fashioned after the sufferfest 4dp workout that I like see in this link: HIE understanding - #41 by skinner_ron
Did you end up sharing this workout Ron? Had a quick look and couldn’t see anything named 3dp in coach library.
‘Love’ the sufferfest 4dp, one of the only times I’ve got a gold BT.
The other thing is that sprint power requires limited aerobic ability, so a beginner can put out big numbers. It’s mostly strength. Threshold power is mostly aerobic and that takes time to train. So as a beginner, the longer the focus duration, likely the worse your ranking will be.
I also wouldn’t worry too much about signature right now. It seems near enough. Best way to get accurate is to keep feeding new BT data in a variety of ways as mentioned already. (But don’t go for a BT every day!) Have a look at the BT thread and compare yours vs some of the others and you’ll see that your longer interval didn’t bring MPA down to interval power output, but your sprint at the end of the interval did… next time try extending the interval at the same power till you reach a BT…
Ok, so even inactive people may be stronger than 50 % of the XERT-Users in power sprinting, overweight actually may give an advantage here, because it’s mostly strength. Makes sense.
You are right about that. As soon as I saw the MPA below my actual power output, I was really motivated for a solide BT and went all out in sprinting. But what is the actual difference between this kind of BT and if I had ended the interval with the same power till fatigue?
Yeah, I got that Will limit BT attempts to 1-2 in a month. But still, intervals are way more motivating than 2h with 130 watts, even with good weather and nice surroundings.
It is really hard, NOT to do intervals if you feel fresh and stay well below LTP.
I have tried the shareme extension the name is 3DP- test SHAREME. It should be visible if you join the coaching community under coaches, shared coaching community.
Yep. Very plausible.
You are looking at a combination of body type/physiology and associated performance stats compared to population group selected. It might be helpful if we could toggle between the default mix of values or strictly W/kg or Watts. Perhaps that will be a v2 feature along with a timeline slider.
While performance markers will improve over time (especially for beginners) I don’t think the general outline of the spider chart will change much for most of us. Basically it’s our genotype – for better or worse.
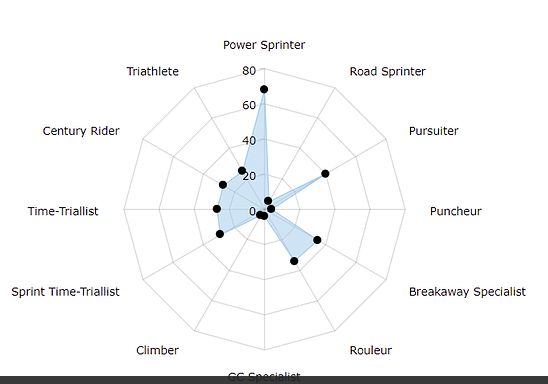
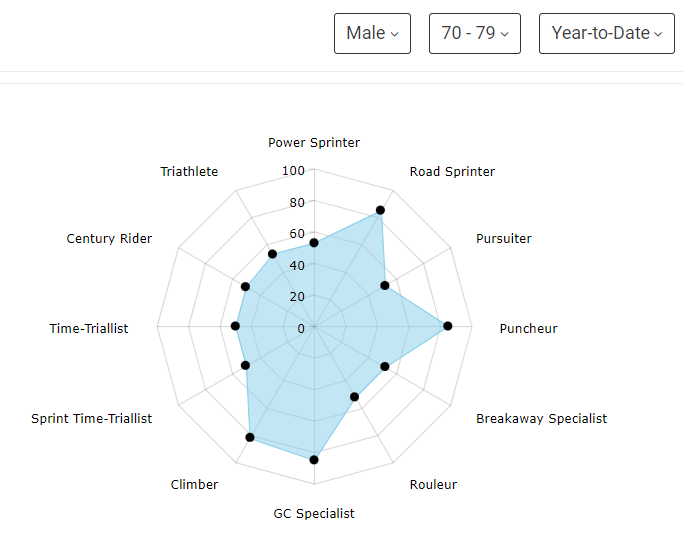
I am a small skinny old guy on a bike at this point. My spider chart looks like this.
What I am most surprised at are those with circular plots topping the 90th percentile across the board. No way I’m hanging onto their wheel for ANY amount of time.
That’s fine with me as into it for fun now and the occasional PR on Strava. YMMV
Funny, your ranking spider is quite the opposite of mine: strong in w/kg, weak in absolute (ok no, I am weak everywhere, only above average in power sprinting, whatever the reasons might be).
A friend said, seeing my awkward spider: “If you are so much better in power sprinting than in any longer duration (longer than 10 sec), then cycling is probably nothing for you. You just dont have the genetics for endurance, obviously. Not worth it, not even for fitness.”
your specific weaknesses seem to all relate to watts/kg and that makes sense at a body weight of 150 kg and at a height of 1.9 m. You are a big person. You probably have great physical strength as shown by your PP. PP is typically not a function of weight since most sprints are on flat ground. Thus your High power output for short duration is why the things that are high are high. These are all simple average power per time. Because you are probably on the far right side tail of the bell curve for the weight of Xert users then you will likely be at the low end of the watts/kg scales as well. The median watts/ kg based upon a TP for a climber in this age group is 3.8 w/kg. For you that would mean a TP of 570 watts! (ie 3.8 w/kg = 570w/150kg) So that is never likely to be in your wheel house so I see nothing inherently wrong with the spider graph.
just an edited add on: if you use Armando’s magic equation HIE*1000/(PP-TP) for your signature you get 29.8 which is right in the normal (or so it seems the range is somewhere between 26 and 35ish) range for signatures so that seems very right as well.
The algorithm is proprietary and I don’t have the detail, but my understanding is that it affects the allocation of work to the various parameters… the sprint allocates more improvement to PP and HIE, the long steady effort with longer time near MPA allocates more to TP…
one more hint that this may just be your reality:
go to Bike Calculator on the web http://bikecalculator.com/
and punch in some specifics for a climb. Say 5% with your weight, for argument say no wind… the result says you need approx 310 watts to climb at 12 km/h. At your weight that is 2.1 w/kg which is rather below the median of 3.8 for your age group… as you can see this graph is just saying what the laws of physics dictate. At your weight you have to accept anything that relates to watts/kg is not in your current wheel house. Xert is a very powerful platform and has a lot of little things that allow you to look more deeply into your physical abilities. It takes time to get up to speed but once you do it does actually seem to work most of the time. no model works all of the time for everybody, that is not possible. Because you are probably a bit of an outlier from the mean Xert user it may have a harder time with your abilities but from what I see it seems pretty bang on.
I got that with my weight in any comparison in w/kg with other XERT users I am pretty much doomed Never questioned that.
What I actually questioned is, how can my PP be above 60% of the users in my age and gender group, while I did never any sprint or power/strength training at all. Seemed a bit off. But I understand now, that this might just be the case, for genetic reasons or whatever, and the signature may be spot on.
So even in absolute watt values I can be <40% or even <30% in pretty much all durations, from 2 min to 3 hours, compared with other XERT users of my gender and age and only in power sprinting >60%, whatever the reasons may be.
I think you have to assume you are not the average user. The interesting thing is at some point in time you did a full on sprint, this is how the PP is determined. It is as noted one of the things that is easy to see in a file (I think it is 3 or 5 second duration). So that is just a fact that you are super powerful. The rest is relative to people who just are not in your weight category, regardless of age. I bet if you look at the distribution of weight for Xert users you are on the far right of that scale. So don’t worry and don’t spend too much time comparing, in fact I almost never look at this chart. Watch your metrics and see how you personally improve. As you gain power and/or drop weight your numbers will all improve and so will your speed. Keep at it and enjoy the riding!