Your example can be explained by the numbers not shown in your screenshot.
Namely start/end TL table deltas.
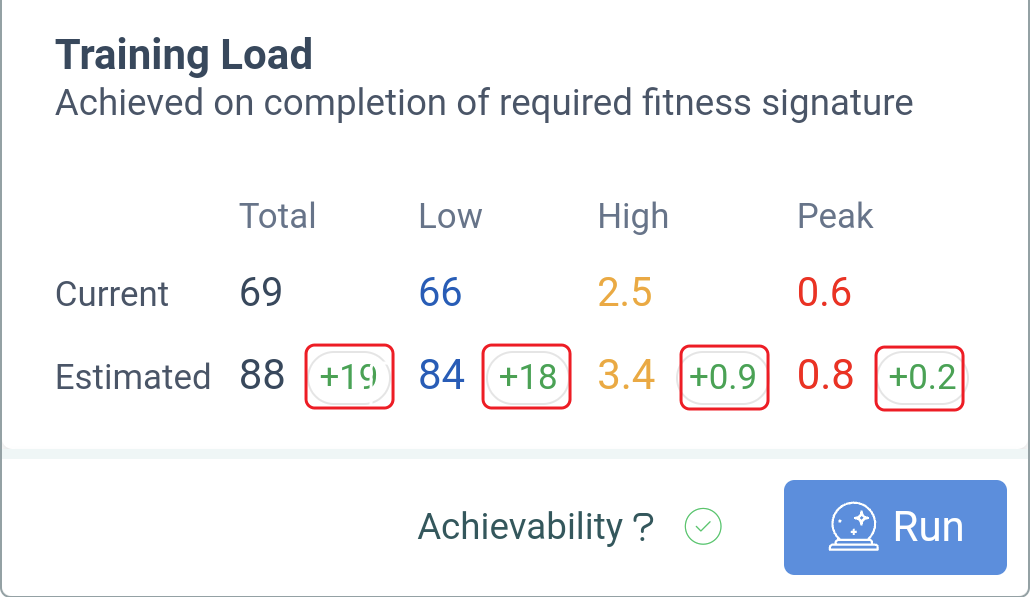
Here’s an example of an 8 watt increase to my 8-minute power before running a forecast:
The other contributing factor is hours and availability. If too restrictive and you are already training at or near your max hours/week that will squash estimated deltas.
If you can run forecasts on a laptop or tablet you can more easily view all the factors before you run the forecast and see how changes to Focus and Specificity affect possibilities and projected deltas. For example, try Polar GC Specialist or Breakaway Specialist and note the difference in possible watt increases before Achievability text changes from green.
I’m not seeing what you describe in any of my forecast tests, but I’m only defining a rest day and most days have no restrictions.
Bottom line: If a forecast results in a flatlined TL graph, there is only so much improvement you can squeeze out of it. One thing you can try is increasing intensity on HIT days by adjusting XSSR (Difficulty) under General Setting. The question then becomes whether you can handle that increase. ![]()