I’ve been training for years, and just new to trying Xert. Is the FTP Estimates any good, or get better over time? current estimate seems pretty good, but historic graph is all over the place.
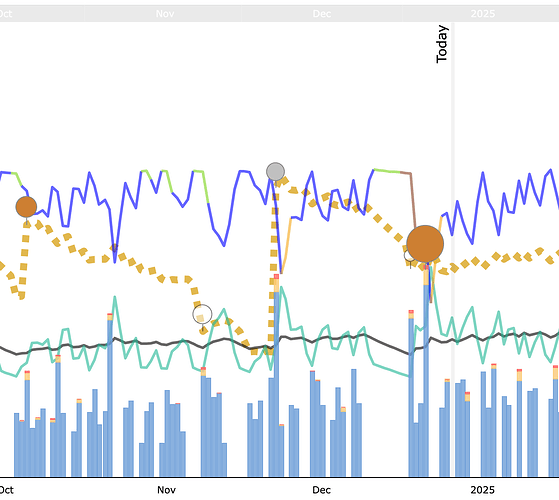
What you are seeing is the interplay between Signature Decay, Training Load (TL), and Breakthrough (BT) adjustments when decay meets your next activity that includes some maximal efforts under fatigue that may generate a BT.
If you zoom in on the chart the story is told through the matchsticks where blue is low strain (below TP) with high and peak strain (abovie TP) is represented by yellow and red bands.
All blue and rest days result in more decay but you can change the decay method if you prefer signature changes more closely align with changes in TL only. You might do that for extended base training periods (mostly low strain) after you’ve established your starting signature is in the right ballpark.
Xert is constantly updating your TP after every activity or lack of activity (decay).
TP isn’t FTP but serves a similar purpose. The numbers are close for many users but they are not measured in the same way. Traditional FTP tests are not required with Xert.
BTW Xert excels at training outdoors and analyzing those efforts whether you free ride or roughly follow a structured workout outdoors. That plus the Zwift integration options will provide everything you are looking for.
Lots of newbie tips here – Onboarding steps for Xert trial users and newbies - General - Xert Community Forum
Couple points. 1. Show the axis since the variation may look big but may only be a few percentage points. 2. Optimal Signature Decay Method will bring your TP down relative to your Training Load. If you draw a line that’s bisects the highest circies and parallel with the black line, you might see something that could resemble an analysis using “No Decay - Training Load Matched”. if the hatched line drops and drops more through an open circle, it might pick up a period of fitness loss that you can ascertain as real or not. Using No Decay may miss these periods.
Thanks for your questions!!
Changing the decay method made a little, but not much difference. I see decay while training in dec and more while off a week for the holidays, so fatigue and rest don’t seem make a difference. since I just did 4x8m threshold workout today at 15 watt above the xert estimate says (which felt like it could have been a sweet spot, so is FTP I am using is probably low) I’d say he xert TP estimate is pretty much crap. I still don’t understand why it does a big threshold drop after a “Breakthrough” make no sense (yes understand fatigue estimated into it), and anecdotally doesn’t seem accurate at all for an early season training cycle. I have 3 weeks left on the trial, so will continue to evaluate. Does this not work for early base periods where 90% of training is z2?
you can set decay to no decay if you are in base training I think.
I just leave it on optimal and do a hard free ride or hardness test once in a while if I feel my signature is going stale.
If you’re unhappy about a near breakthrough where your numbers drop, there’s the activity flag operation you can use to cancel it. (You have no idea how many complaints we get from new users that are unhappy about a drop in their FTP!). Xerters get it though. It just bounces back up with the next breakthrough. Always good to prove to yourself (and system) that you’re as strong as you think. Near breakthroughs make that possible.
What was your breakthrough?
If you have a big increase in peak, it might drop TP. Not uncommin with new users on the trial where it has limited data to work with. Once you get a few hard efforts in it will be more accurate.
Since you’ve been training for years you are likely suffering a bit of culture shock as to why your FTP wavers and particularly when the number declines. The way TP works in Xert (and how it’s derived) is a paradigm shift from the old-school method of periodic RAMP or 20-minute tests to assess FTP level between training blocks. There are a several reasons why the traditional approach is flawed but let’s move on and discuss what you are experiencing and why.
It will help if you post the BT reports from your most recent bronze BT (largest circle) and the silver one prior. These reports can be generated by viewing activity details and click the report icon above the title.
![]()
This will let us know what type of BTs they were and from what type of activity.
You can also post the BT report from the activity where TP declined. There are reasons why that can happen. Another way to consider BTs is as signature alignments. The three parameters in your signature can adjust up or down depending on the type of activity and associated alignment.
As far as decay goes it’s relative to your current TL, how frequently you ride, and at what intensity and durations.
Normally we are not talking about large jumps on a week to week basis. To see your daily Signature fluctuations view your Activities Table.
Let me know if you’d like a breakdown of your XPMC and I’ll point out what I see from the historical data you imported for the trial.
