@ManofSteele Have you considered adding the glycogen level as a plotable variable in the chart? As far as I understand the reason why we see a drop in the available power at the end is linked to that variable.
So is the ask that as we’re looking at rides in 2.0 to enter what we think we ate, but then less some amount for the endogenous carbs?
In that case it would be better if you could enter the fueling for each activity, and then incorporate some constraints on the update as part of the Xert settings/fitness signature.
You could even timestamp the intakes during a ride as EatMyRide does.
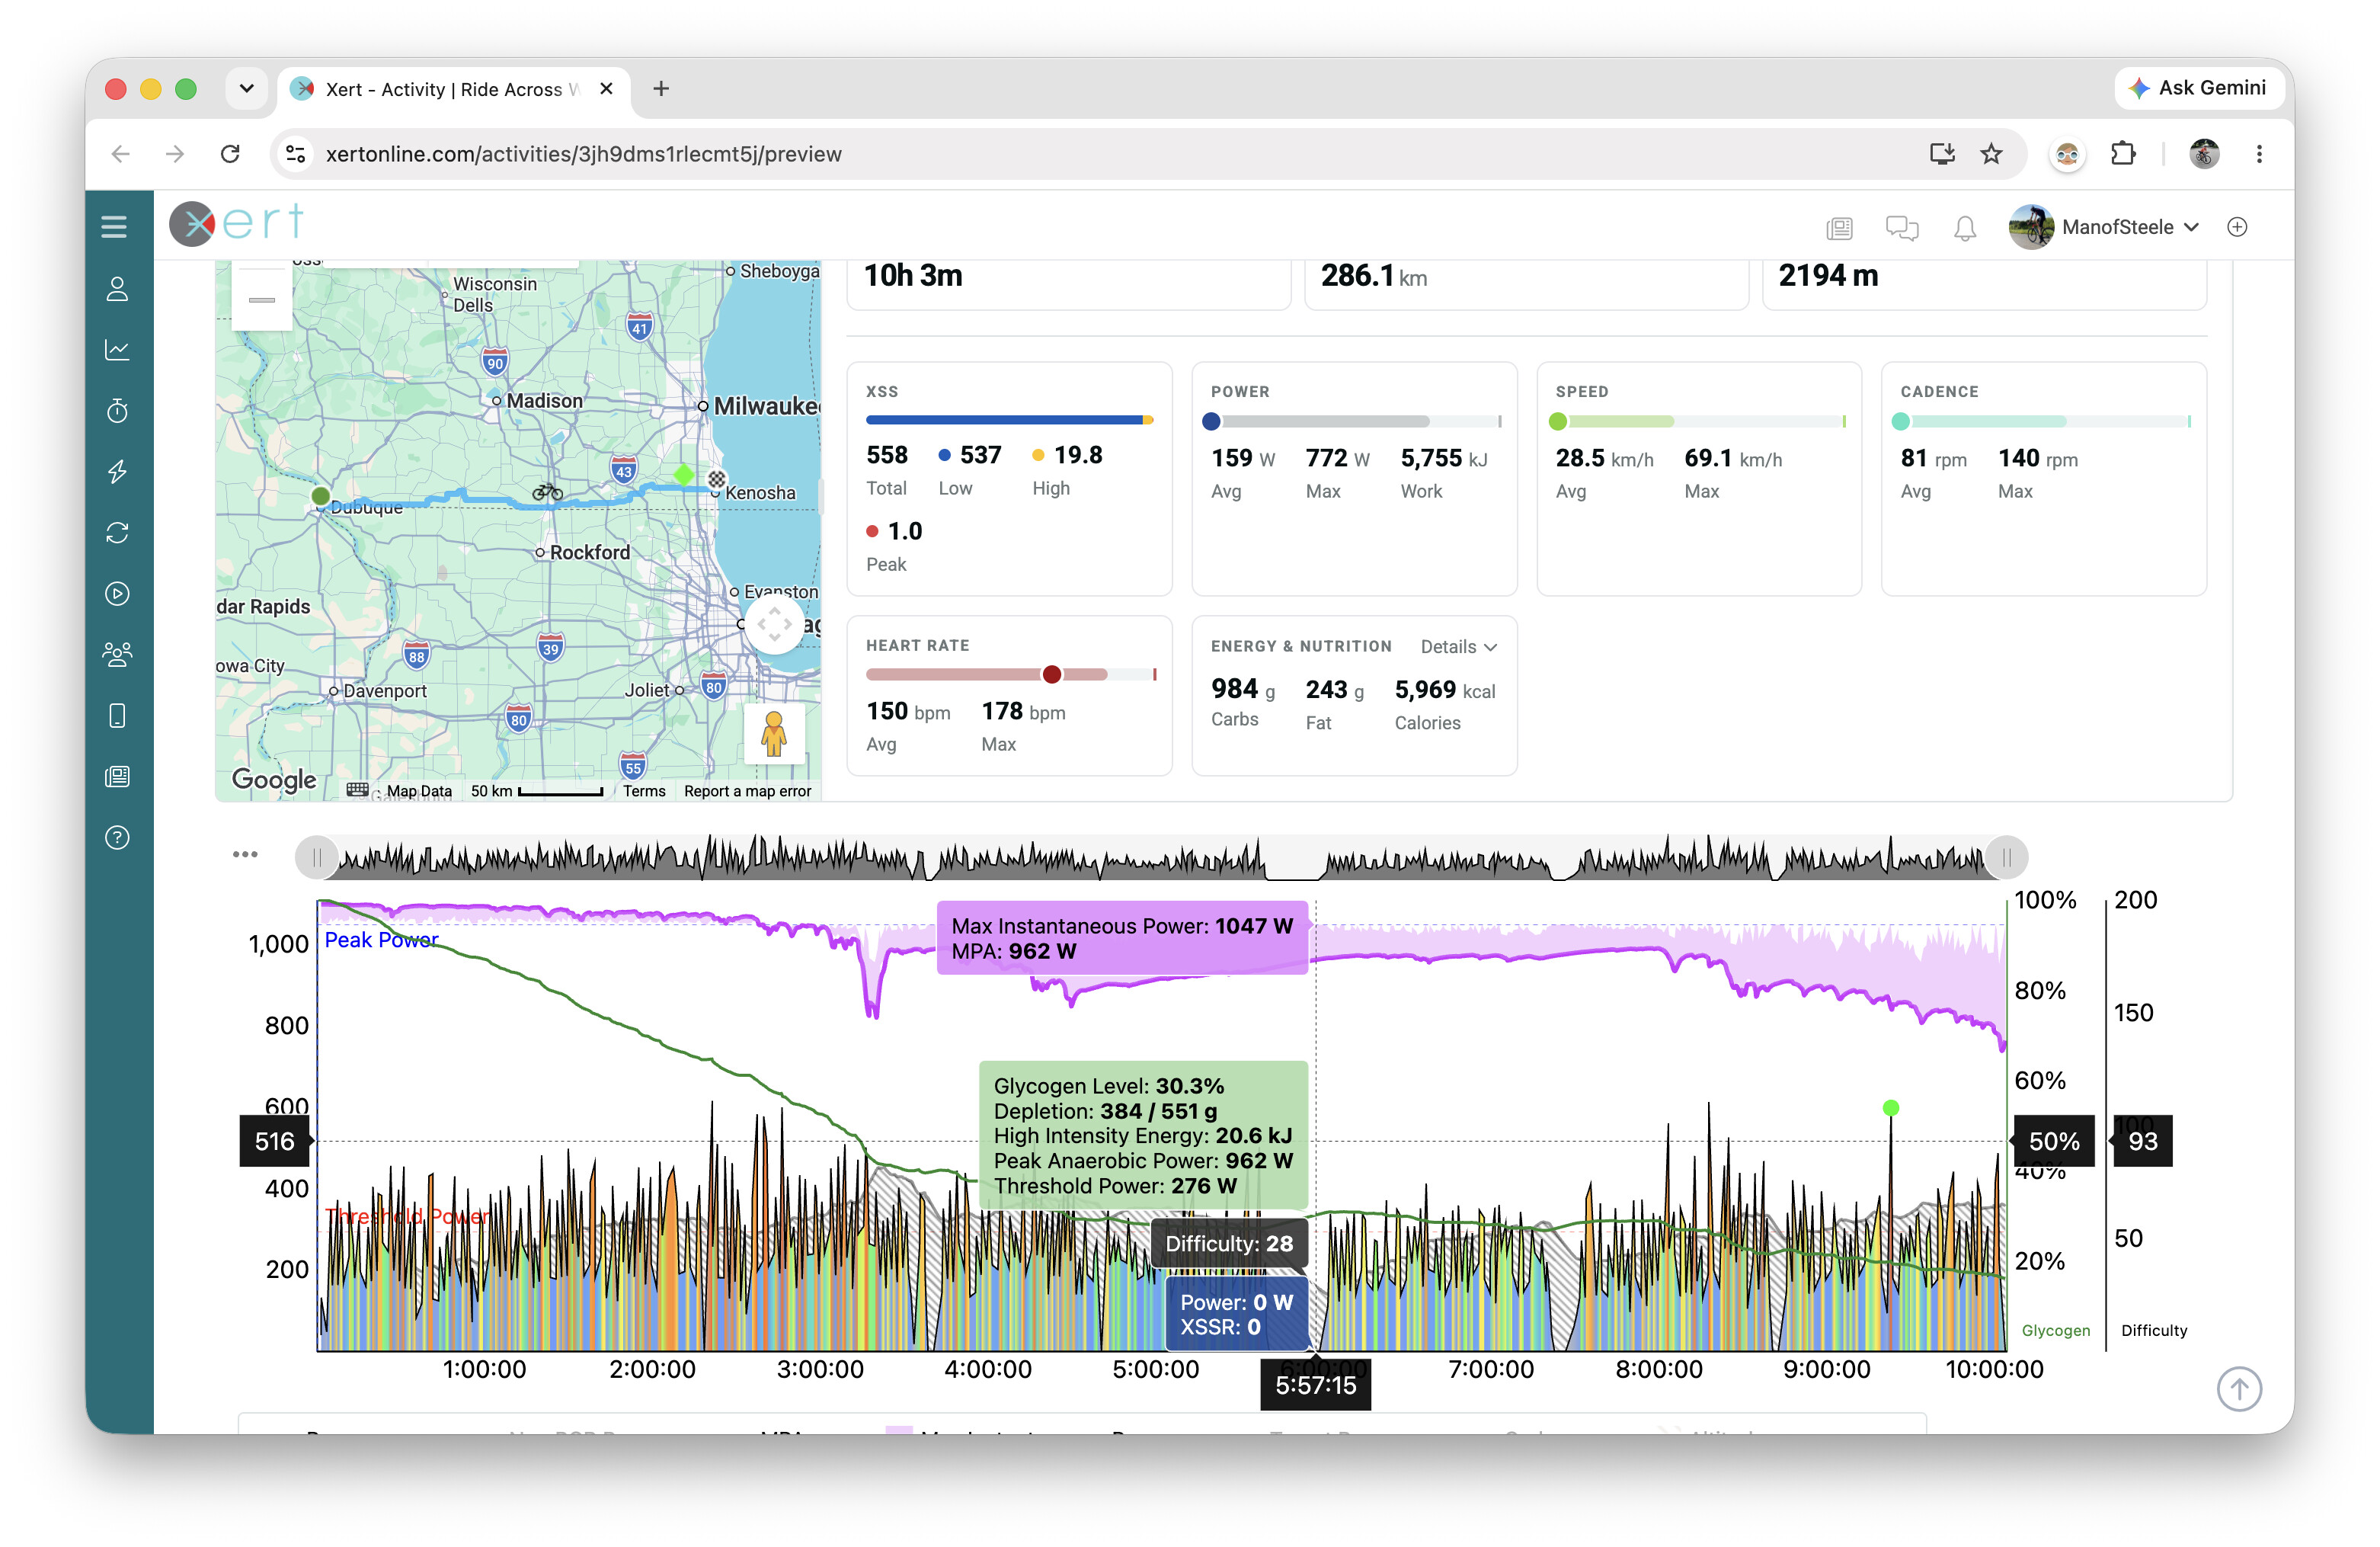
Already added it!! You can enable ‘Durability Info’ at the bottom of the new activity details page and it should show the estimated Glycogen depletion, along with the change in your signature as glycogen levels are depleted.
Here’s an example from one of my longer rides. My starting signature was 293 W TP for this activity, but Xert estimates it had declined to ~276W by the ~6 hour mark (assuming assumed ~75g/hr glucose uptake) and it continued to decay all the way down to ~250W by the end of this ride.
1 Like
Correct. These are all good discussion points.
If I eat 120g/hr while noodling along at 50W, the physical energy demand is too low to possibly burn all those carbs (it’s simple physics). Those carbs then either just sit in my gut (causing GI issues), or potentially they could be used to replenish muscle/liver glycogen (if they’re not fully topped up). Or perhaps they’re used for basal metabolism, which we don’t aim to model.
We’re also unsure of whether glucose uptake is something that is trained in the same way that our signatures respond to training (e.g. more XLSS = increase in TP, less training = TP goes down). If that is the case, MGUR would become a signature parameter. But I’m not sure if this is the case.
To me, it seems more likely that glucose uptake is more of a per ride parameter that depends on the overall energy demands of the ride & the availability of glucose. If I’m doing a hard ride & eating lots of carbs, it makes sense to me that glucose uptake would be higher than a ride where the overall energy demand is lower (e.g. Z2) and a good portion of the energy demands can be met via fat oxidation. Curious to hear other’s thoughts.
Thanks, I didn’t see that. Has it been there all the time?
@ManofSteele In the example you showed that the uptake is also limited by the demand by your body. If the uptake capacity is higher than what can be utilized it will be capped.
But for the sake of understanding, let’s say I am eating nothing during a ride at a reasonable power where there is a significant demand for glycogen. Should the uptake (MGUP) still be > 0 g because the update will come from other parts of my body? Whatever I eat before the ride will also be processed during the ride and contribute to the “uptake”? If I eat 200 g of carbs from say pasta just before the ride is it reasonable to assume that it will give an uptake of 60 g the first hour, 60 g the second hour, …, assuming pasta can be broken down fast enough?
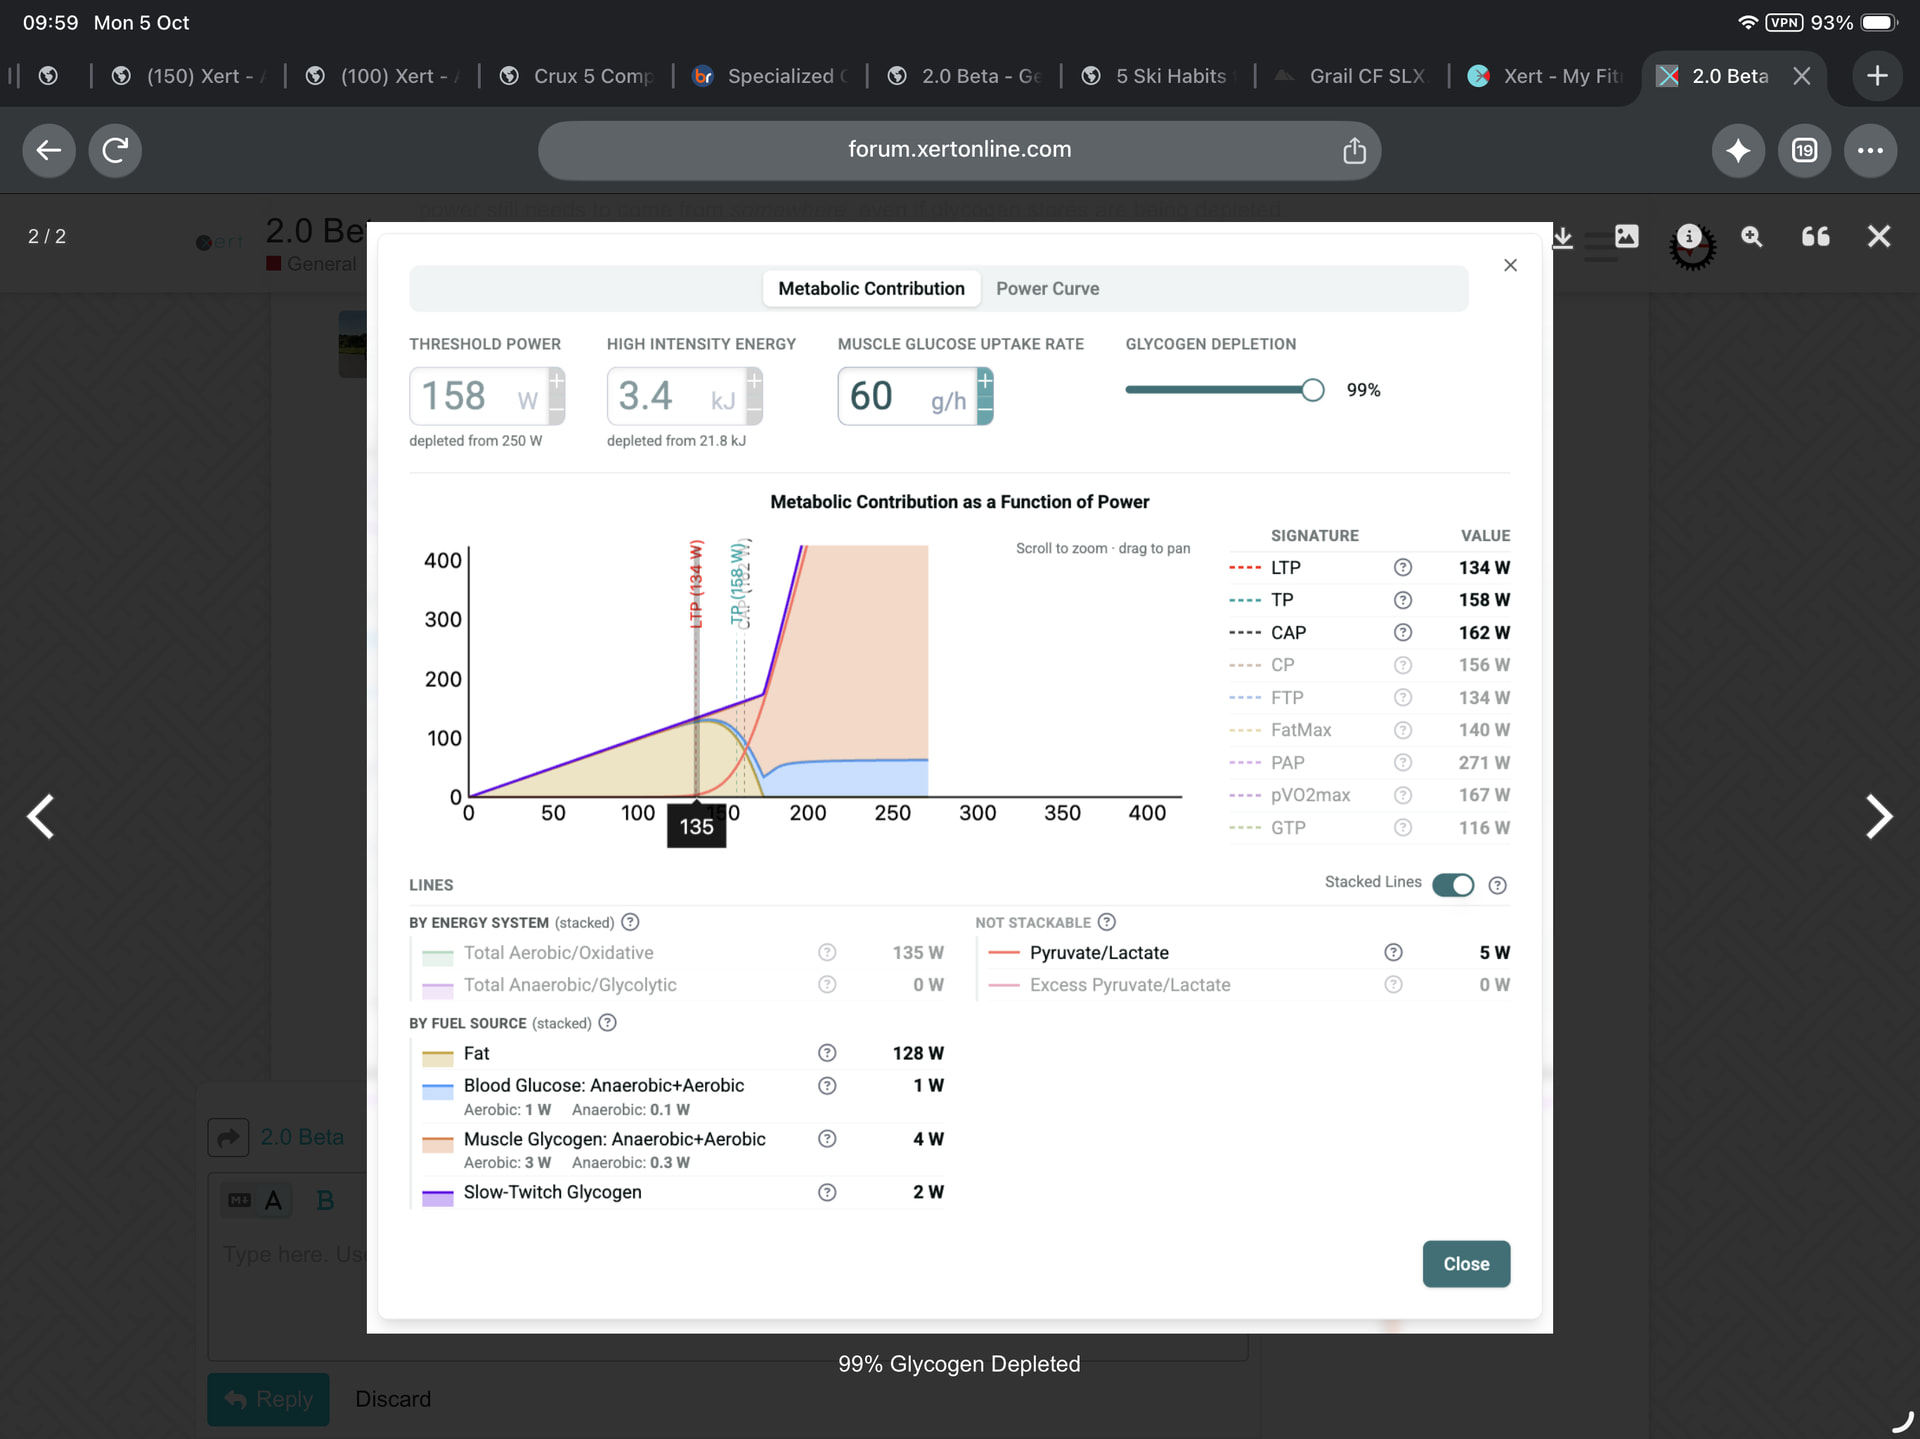
@manofsteele Where can I find this chart in Xert 2.0. Well done by the way, this represents a massive leap for the platform!
1 Like
Found it! For those that don’t know scroll down to the activity chart, there is a button just above it labelled ‘chart.’ It can be found there.
Yes, for now, there is a ‘Chart’ button under the ‘Fitness’ tab that will show the metabolic contribution & power curve. You can move the slider to see how metabolic contribution shifts as glycogen is depleted.
Many thanks for the quick response. I am interested in how the model calculates fat max in comparison to an INSCYD test. The fatmax value is essentially the same as LTP. Sentiero (similar to inscyd uses the Mader model) and INSCYD will give a fat max range that tends to be quite a bit lower than the range quoted by Xert for the same test. For example LTP 302, fatmax 298 in Xert vs fat max (training zone) 238-266 with the programmes using the Mader model. Is this just a function of how the information is packaged? I wonder if inscyd/Sentiero package the value in a different way and give a range that is sustainable (i.e. not associated with significant carbohydrate burn). They do suggest on the inscyd website the range is dictated by +/- 10% of peak fat oxidation value. Is there a way we can work out our fatmax range using Xert? Does it require a certain testing format to be accurate?
I’m totally confused with the new calculations substrate utilisation in the Beta 2.0. One of the reasons is that it doesn’t seem to align with what I know or thought I knew about the subject. I also have no idea how to use the information that is presented to me.
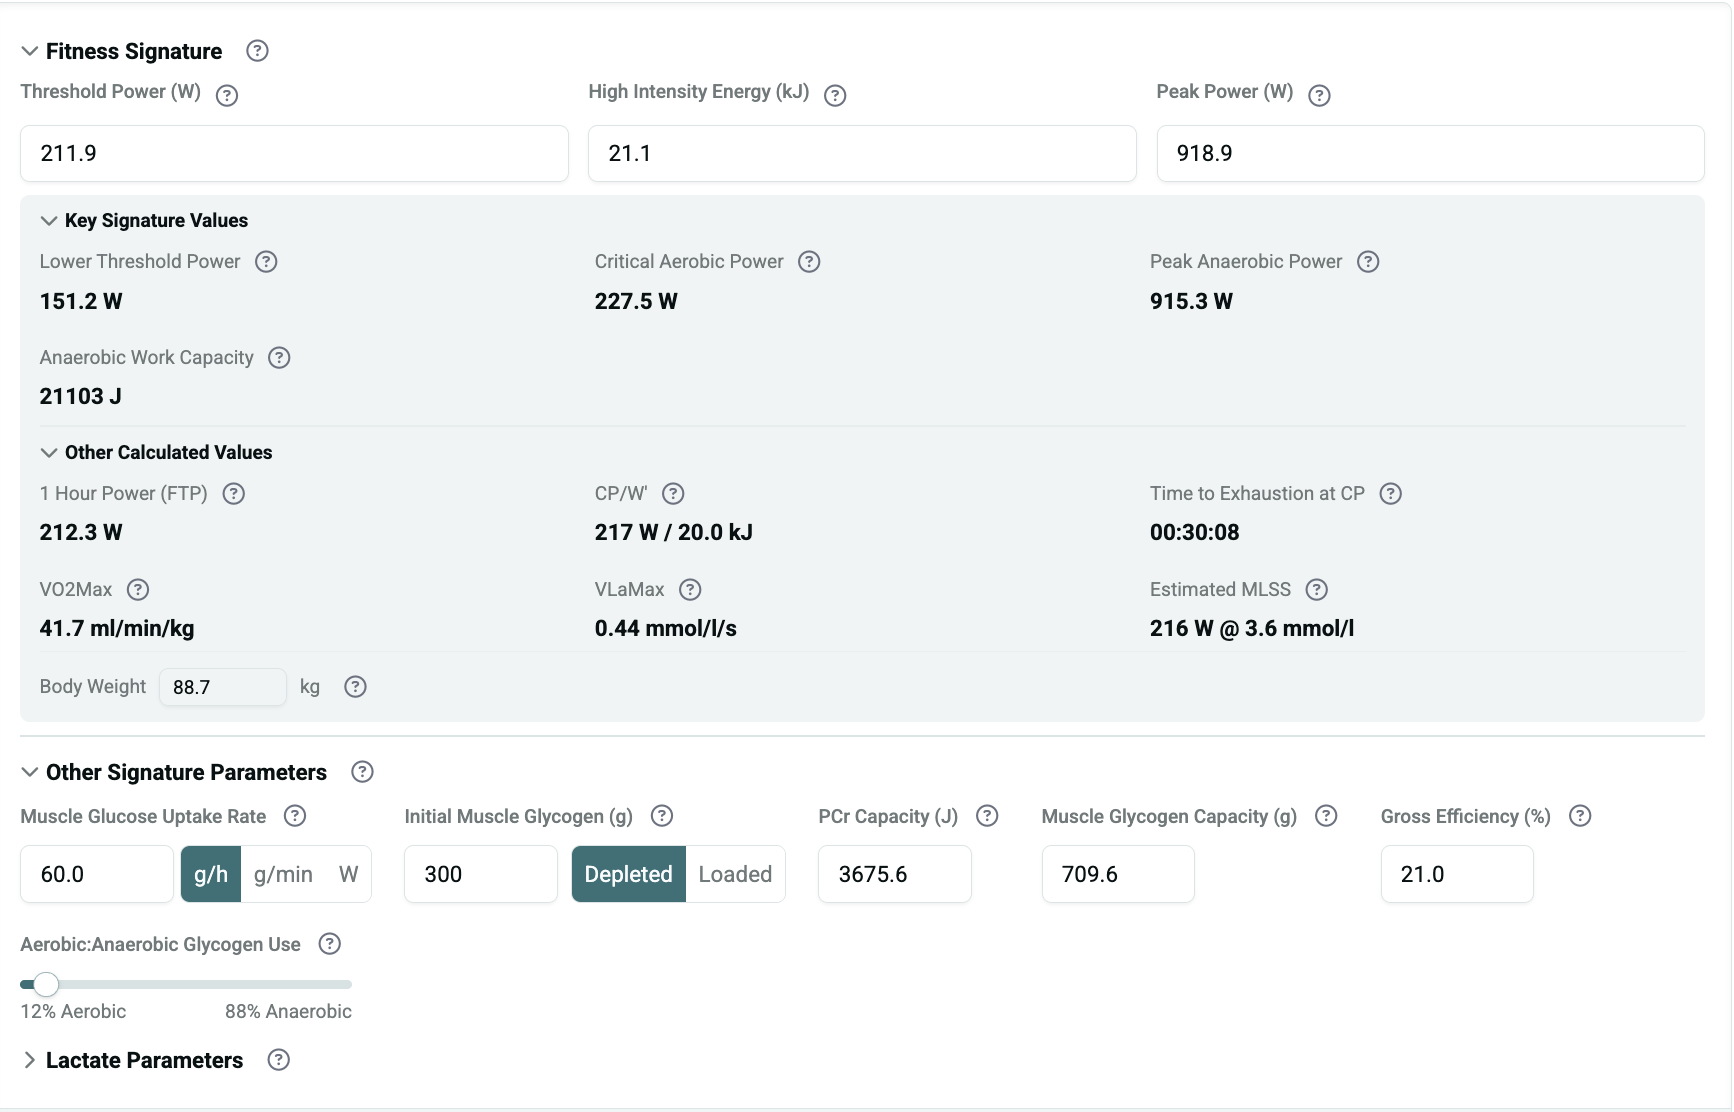
I did a reasonably long easy bike ride yesterday. 5:45hrs riding 7:37 total ( Also in 2.0 it quotes total time not riding time. Is this deliberate or and error?) After the ride I made the following alterations in Beta 2.0 to suit better my individual characteristics.
Gross Efficiency to 21%
Initial Muscle Glycogen 300 Depleted.
This is what I got re FAT & CHO usage
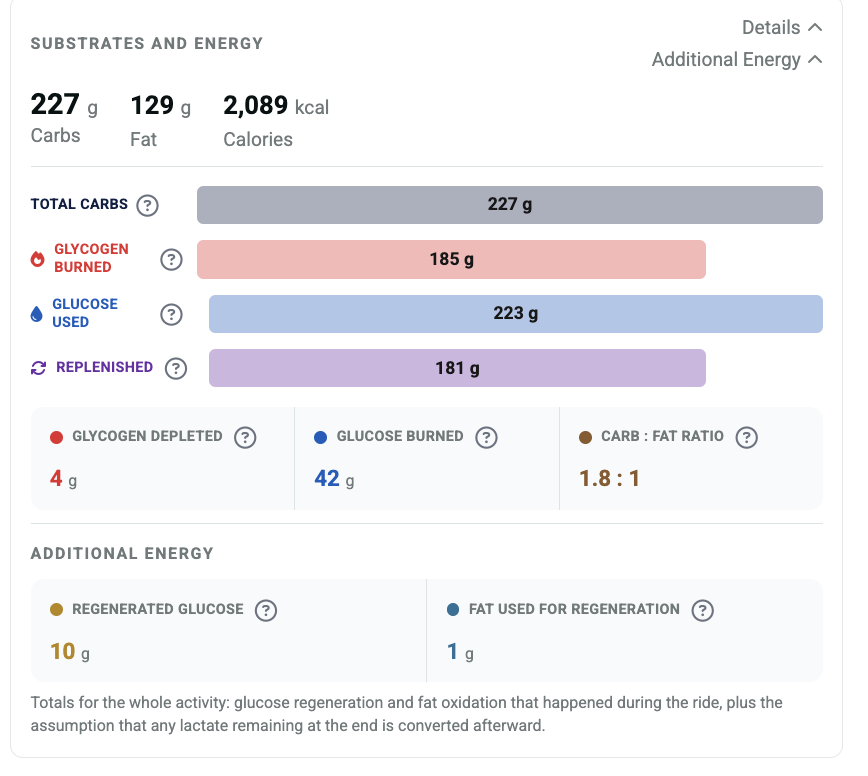
How do I use this information for future rides. I have difficulty in believing my muscle glycogen was only depleted by 4g
How much should I have eaten on the ride and why?
What should I do about the Aerobic Anaerobic Glycogen Use? Are the numbers shown 12% Aerobic 88% Anaerobic calculated from my signature or just random nubers that I am expected to alter, if so to what?
Thanks
First of all, would you be willing to share the MPA chart for the ride? It’s always good to share that so that other people on the forum can also see the data and better understand your question. Transparency is good 
To answer some of your question…
- Were you fueling throughout this ride? How many g/hr carbs, roughly? Across the whole ride as you mentioned, the avg power is (relatively speaking) quite low relative to your TP, so long as you were eating a decent amount of carbs, the logic is that your body is drawing from blood glucose preferentially & sparing muscle glycogen. Interestingly, you’ll see very minor restoring of glycogen levels while you’re stopped/resting via Cori cycle! Generally speaking, glycogen depletion occurs more rapidly when you’re riding close to or above Threshold, especially when you’re not fueling adequately. Try changing your MGUR to 0g/hr and look at what happens to glycogen depletion.
- You pre-depleted your glycogen level by nearly 50%. Pre-depleting muscle glycogen shifts metabolic demand below threshold towards more fat-burning as body aims to preserve it’s remaining glycogen stores. Try resetting glycogen depletion to 0g and you should see some increase in the total estimated glycogen depletion (especially when MGUR is set to 0g/hr).
- ‘Aerobic:Anaerobic Glycogen Use’ is a good question for @xertedbrain to elaborate upon.
Based on 1 & 2, it seems that the model is behaving how it should, at least with the input of ~60 g/hr for MGUR and with 300g of pre-ride glycogen depletion.
I’ll also have to check - I assume that the ~4g depleted in your screenshot is relative to the ~300g that was already marked as pre-depleted, meaning that you’d want to aim to replenish ~304g (not just 4g). Maybe @xertedbrain can confirm that for us as well.
Also share your options. Click on the Durability Info on the legend to follow your glycogen depletion over the course of the ride.
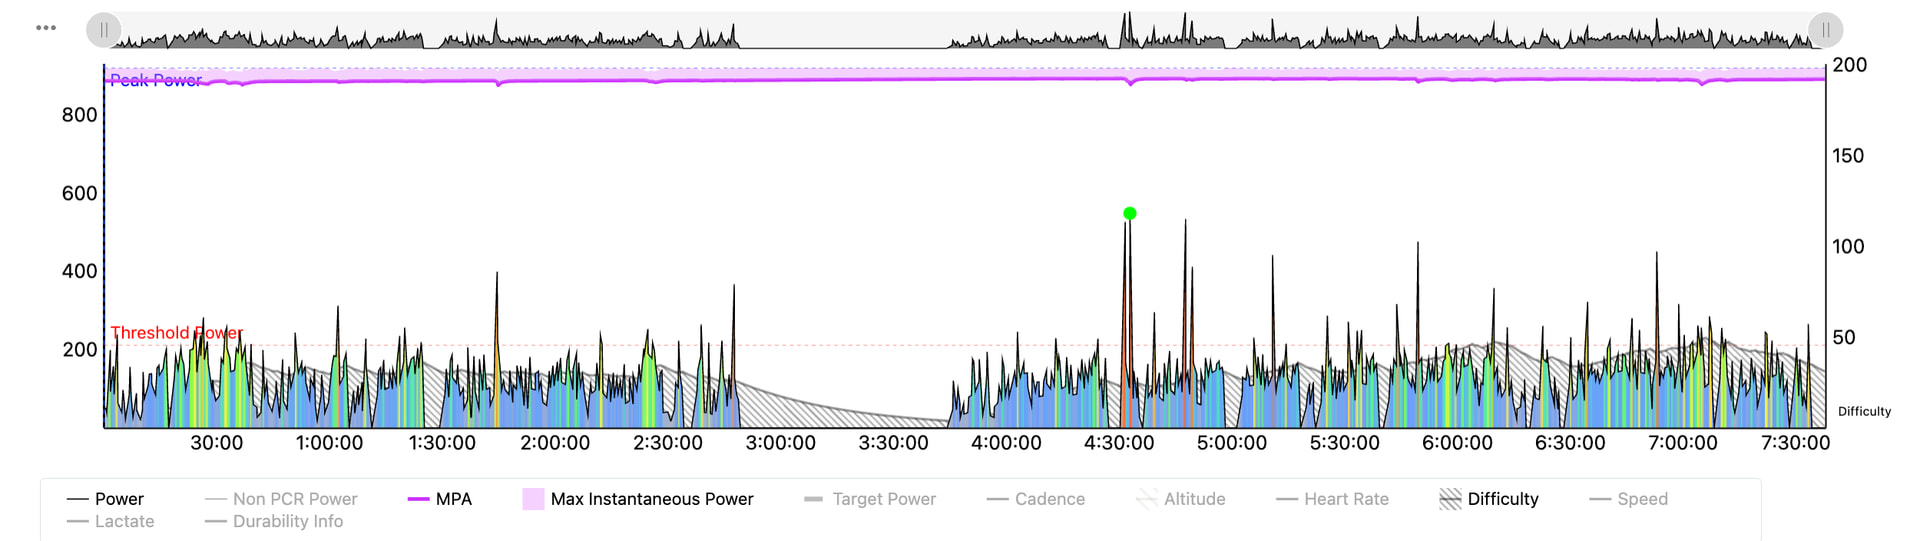
I ate and drank 205g of CHO including the lunch stop.
Yes the low average power was basically because the around and slightly above LTP efforts were slow riding and chatting. A lot of it was in urban areas with a lot of stop start riding.
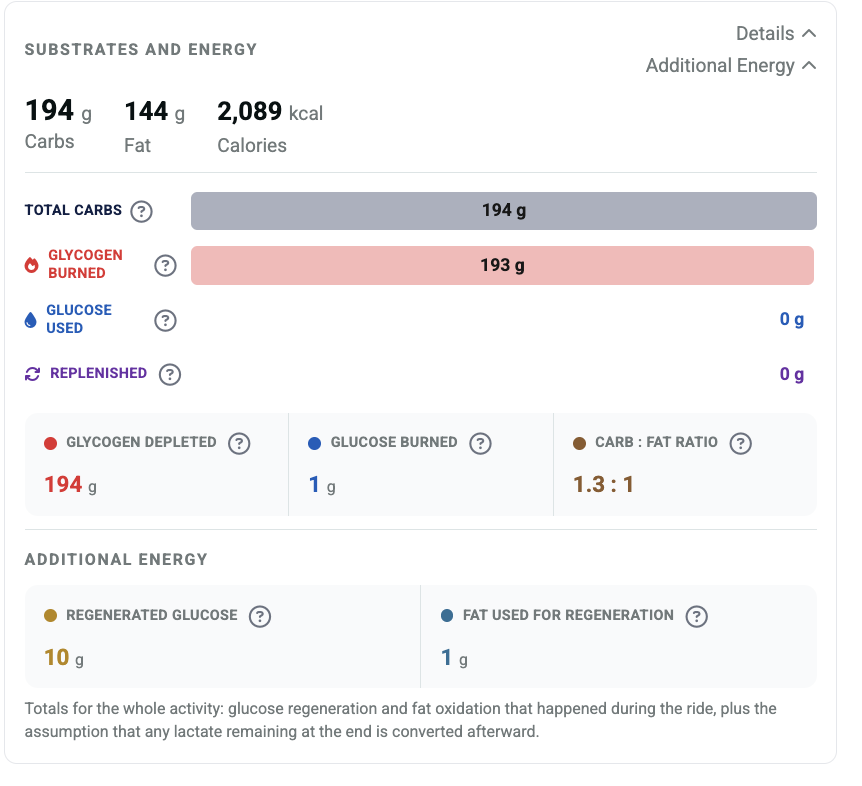
I reduced my reduced my initial muscle glycogen depletion by 300g as a) I took 710g to be the maximum in the legs of a very fit young athlete who had tapered and carb loaded prior to the ride . I did non of those things and am 70 yo. the 400g aligns closely with what my previous queries with 3 AI engines said should be a best guess for someone like me,.
If you need any more information please justb ask
Glycogen replenishment depends on depletion status. If you are not depleted, you can’t replenish your glycogen. (Sorry for stating something obvious but it makes sense to clarify sometimes). The greater the depletion, the faster the replenishment.
When you input the 300g of depletion, the model replenished your carbs over the course of the ride. The rate is differentially based meaning the more depleted you are, the more blood glucose is used to replenish and this raised your glycogen levels during times of soft pedaling or rest. You can see this happening when you open Durability Info on the chart.
On this ride, you did a lot of replenishment if you started with 300g of depletion. So much so that you barely used any glycogen by the end. It was replenished by the glycogen in your liver, glucose in your blood, in the food you ate and what was converted via GNG. So you barely depleted any. That makes sense if indeed you started 300g depleted.
Play around with things a bit more to get a sense of how it all adds up. Note that much of the model is backed by scientific evidence. This will be laid out in our white paper(s).
I can’t see where to do this on Beta 2.0 page
Durability Info can be enabled/disabled from the MPA chart legend!
Cheers. Found it hiding in grey at the bottom left.
Hopefully it will be out soon
I found a paper from 1987 which backs that up and has changed my thinking somewhat