Checking out the new Beta stats - curious - where does the “replenished” metric come from?
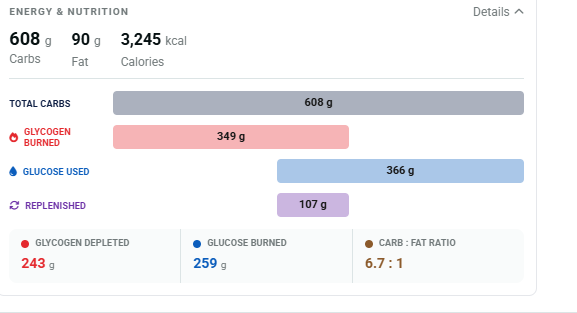
Just played around with it and based on what the Help Tip says it applies the gm/hr entered under Other Signature Parameters from the Fitness tab.
The default is 60 g/h.
Interesting - I would think it would need a user input for how much was consumed during the activity.
That’s the idea. Input your rate during post-ride analysis.
60 is a common target so that’s the default entry.
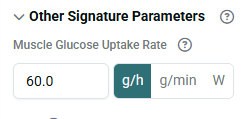
I get your point but that is the term used in medical journals and studies that reference the process.
I asked the all-powerful AI chat why that is and this came back –
Because “uptake” describes the movement into the cell , while “consumption” describes the metabolic use of glucose once it’s already inside.
They are two different biological steps.
Does your total calorie burn match what it estimated in your Xert 1.0 activity? I’m seeing some huge differences, like ~30% lower energy consumption for the exact same ride.
I have two recent activities where the calorie expenditure differs slightly to very different. I notice for Xert 2 the amount of kcal differs wildly based on the value I set for Muscle Glucose Update Rate (MGUR).
Activity 1: 6x3min above TP. Moderate Mixed Climber. Total duration 1h 54m.
Xert 1: 1026 kJ work. 109 g carbs. 70 g fat. 1129 kcal.
Xert 2: 1029 kJ work
MGUR 0 g/h: 127 g carbs. 28 g fat. 760 kcal.
MGUR 100 g/h: 198 g carbs. 28 g fat. 1044 kcal.
Activity 2: Easy Pure Endurance. Total duration 40m.
Xert 1: 361 kJ work. 3 g carbs. 40 g fat. 397 kcal.
Xert 2: 361 kJ work.
MGUR 0 g/h: 3 g carbs. 16 g fat. 152 kcal.
MGUR 100 g/h: 56 g carbs. 16 g fat. 366 kcal.
Calories should be the same but carb and fat grams will differ. it is also possible for the total work from carbs + fat to be more than the work you do. This is due to how energy is borrowed to do high intensity (carbs) and paid back aerobically later. If there is not enough “later”, the overall energy from carbs and fat could be higher.
We’ll check out why the calories are different. Looks like there is an error.
1 Like
How much you consume isn’t how much your muscles intake. You have other sources of carbs other than what you eat. You can over consume carbs too if your muscles aren’t able to intake them. All that counts is the intake from the blood in terms of performance. You eat to ensure you can meet that demand.
Calories counts should be better now. We made them based on gross efficiency. You can see how updates to GE now affect total calories:
After following this discussion, could you clarify: should we update that intake field based on the number of carbs per hour we’ve eaten or drink? Or is this field a physiological number that we should let be derived by the system?
2 Likes
Also on the topic of total grams of fat and carbs burned during a ride, it has changed a lot between XERT1.0 and XERT2.0. My endurance rides are normally very fat driven in XERT1.0, but appear to be carb driven in XERT2.0. For example a 1 hr 40 min endurance ride in 1.0 has me at 83g fat and 59g carbs, while 2.0 has 35g Fat and 125g carbs - quite a difference when it comes to fuelling.
I know it is a different algorithm, but does it indicate I should slow/power down further if I want to primarily use fat as the fuel source for my endurance rides?
I think there’s more to come re training prescription (workout builder and XFAI updates). In the meantime you can find fatmax in 2.0 if that’s what you’re interested in - it’s visible in the chart. Personally I think they should also put in the ‘other calculated parameters’ at some point. (Whether you should ride endurance at a lower intensity or fatmax is a different question depending on context - not sure Xert answers that… at least not yet!)
I’m also not sure that fueling should match burned carbs (whether 1.0 or 2.0) - most advice I’ve seen is to replace a proportion of total energy, with that proportion depending largely on duration and ability to digest. You also need to fuel off the bike to cover all your work (plus other activity during the day).
1 Like
Hej there,
I’m sure I’m nowhere fit enough to even think about all that (awesome sounding) stuff, but theres still curiosity, so I got two questions 
Can you already give more insight in how that applies in the future to smart workouts? Since the system has no way to track if blood sugar glucose levels are topped up or emptied (“we met the demand”) - or even more complicated: we bonked and topped up again - to give us real-time numbers at how much work we have done/still have to do or where our MPA is at any given time?
Second question regarding durability:
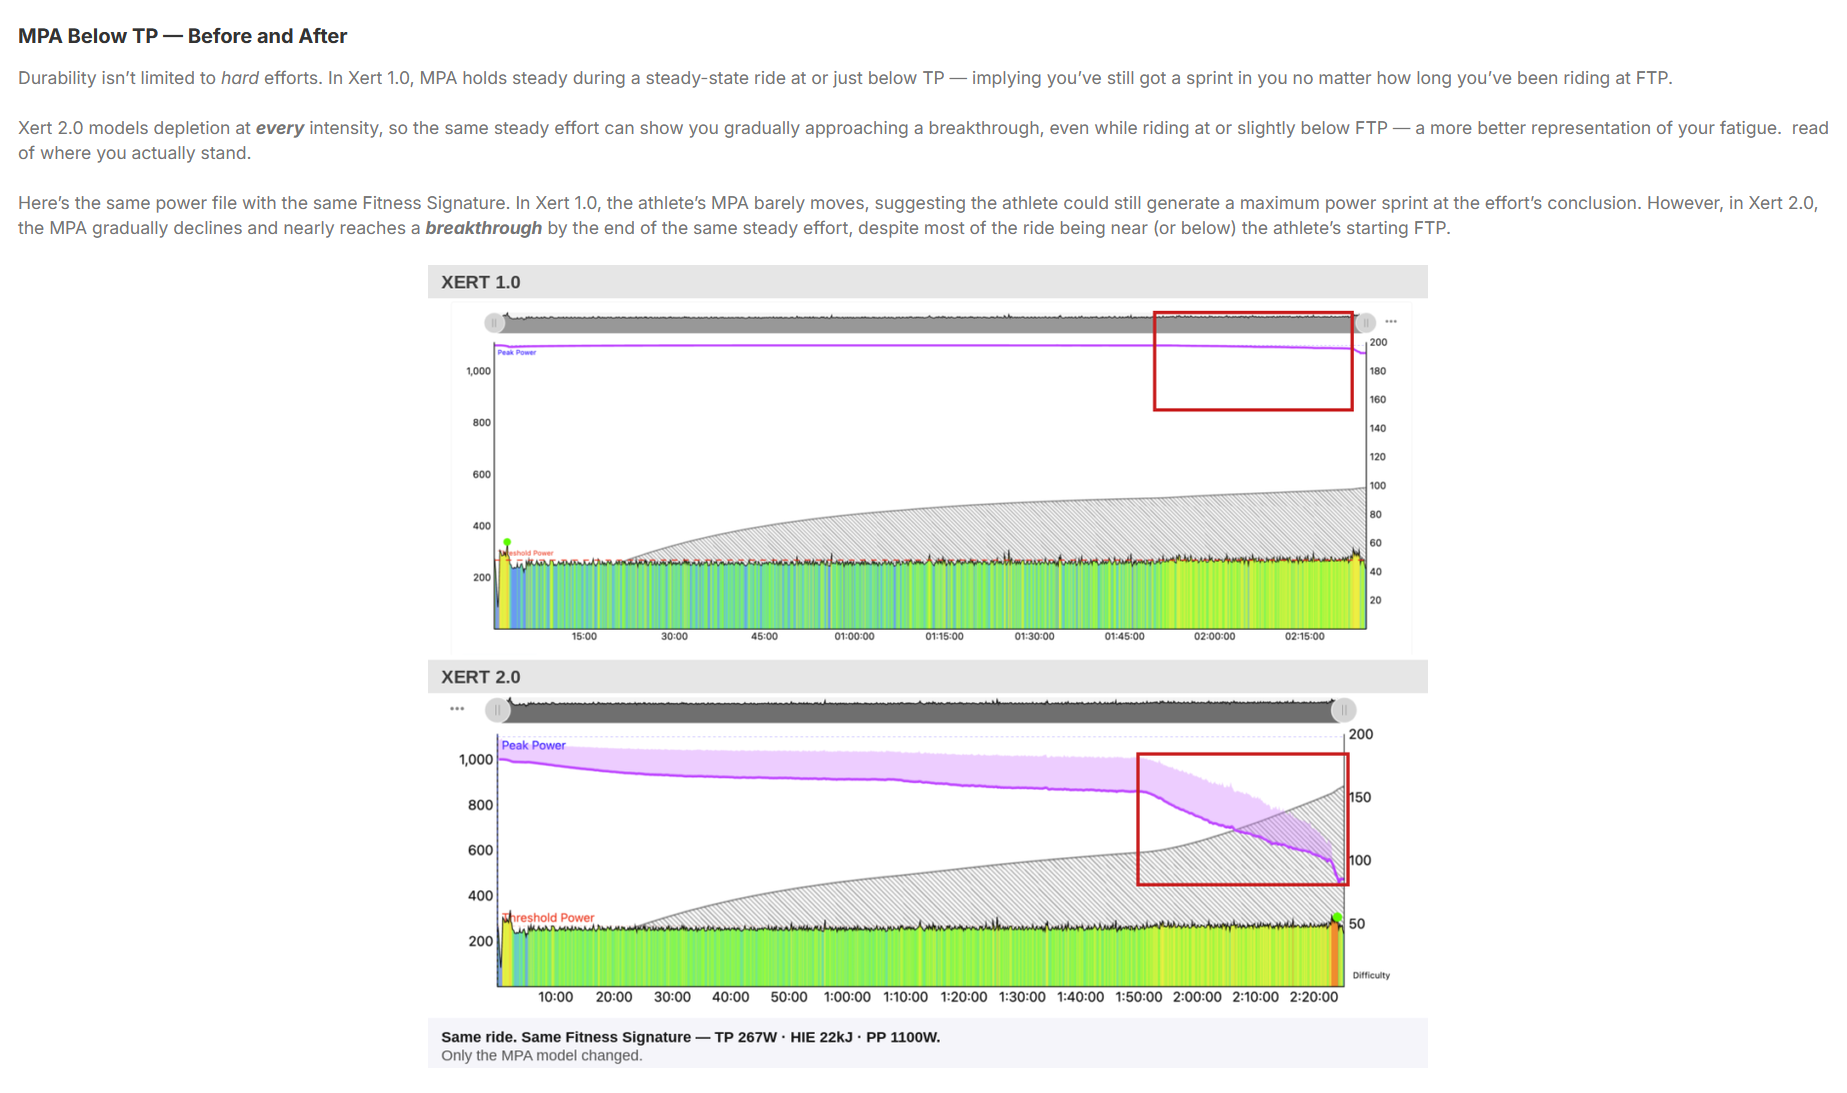
In the example given below: what exactly lead to the sudden change after 90min in the rate the MPA drops? Or rephrased: how does the new system calculate durability?
Through the development of 2.0, have you validated that the addition of each parameter improves prediction on unseen data? For example - start with TP, HIE and PP. Add PCr, then add durability, then add glycogen. Does each step provide a validated increase in MPA prediction for particular ride/effort types?
I realise that at 70 years old I’m not in any way typical of Xert users so on the basis of this ( and I apologise for using AI) would it be appropriate in my case to adjust the Muscle C]Glycogen capacity down from 709.6g to something around 290 to 300g to get a more accurate analysis
“On average how many grams worth of glycogen would a moderately train male 70 years old amd 89kg with abodyFat of 23% have in his leg muscles”
A moderately trained 70-year-old male with these exact body specifications will have an average of 250 to 310 grams of glycogen stored in his leg muscles. [1, 2]
How This Is Calculated
-
Total Lean Body Mass (LBM): At 89 kg with 23% body fat, your lean body mass is 68.53 kg (\(89 \times 0.77\)).
-
Estimated Skeletal Muscle Mass: In a healthy, active 70-year-old male, skeletal muscle makes up roughly 45% of lean body mass, yielding approximately 30.8 kg of total muscle tissue. [1, 2]
-
Leg Muscle Allocation: The lower body (quadriceps, hamstrings, glutes, and calves) contains about 52% of a man’s total skeletal muscle mass. This places your leg muscle mass at roughly 16.0 kg.
-
Glycogen Concentration: Moderately trained skeletal muscle stores about 100 to 120 mmol of glycogen per kilogram of wet weight (roughly 16 to 19.5 grams of glycogen per kg of muscle). [1, 2]
\(16.0\text{\ kg\ of\ leg\ muscle}\times 16\text{\ to\ }19.5\text{\ g/kg}=\mathbf{256}\text{\ to\ }\mathbf{312}\text{\ grams}\)
Key Factors Affecting Your Storage
-
Training Status: Regular endurance or resistance training causes muscles to adapt, allowing them to store up to 20–50% more glycogen than untrained individuals. [1, 2]
-
Dietary Intake: This baseline estimate assumes a standard balanced diet. Going through a carbohydrate-loading phase could temporarily push your leg glycogen stores up toward 350+ grams. [1, 2]
-
Water Weight: Glycogen binds to water at a 1:3 ratio. Holding ~280g of glycogen in your legs means they are also holding roughly 840g of water alongside it. [1, 2]
@xertedbrain I am noticing also in the 2.0 statistics, average speed is being shown as total time even though the account settings are set for moving time
How does the new 2.0 modell affect Forecast AI?
Also it will be interesting to see how it will affect Magic Buckets and training prescriptions in general. The introduction of the PCr buffer into the model attributes short hard efforts less to Peak and HIE. Therefore, maybe Xert Magic Buckets will slightly move away from the “shorter intervals = more efficient training“? Maybe there even is an optimum depending on the athlete type.