Hi,
I found Xert a few weeks back and was very interested in the predictive modeling so signed up, then found without a power meter it somewhat useless. Last week I finally got a power meter so am giving it a proper go now (only a week left in my trial). I’m playing with the workout designer now and think either I’m missing something or it is.
What I find is I can create a workout that is say 4 hours long at 100% TP the whole time and it somehow looks doable. MPA is unaffected the whole workout, difficulty is only 100, and all the XSS/energy used is “low intensity”. Now I’m pretty sure that TP generally defined by the max power that you can hold for 1 hour (and making it to that 1 hour is NOT easy) so this doesn’t seem right.
From what I understand it almost seems like the above behavior is how LTP should behave - you can ride indefinitely at that power and all energy is “low intensity”. I don’t understand how MPA isn’t affected by output above LTP. I would think 1 hour at TP should about use up all the HIE and leave you completely gassed (as a note I see 102.5% TP does exactly this, but I still struggle with NO HIE use at TP).
In my rides I’m seeing something similar - later in a long ride my (perceived) hard efforts barely make a dent in MPA and there’s no way I have that much power on tap. I get that my legs are likely failing me more than my energy delivery system, but it seems like the model is only actually accurate while I’m fresh near the start of the ride.
her is what you might be missing, in the Xert world if you do not exceed the TP then you do not draw down MPA so that means a forever ability to ride at that intensity. Somewhere along the way I read that they are looking at the algorithm to see about adding a duration window on that so that after a certain duration riding at TP will affect MPA. So that is the kicker. The other thing is that though TP is somewhat similar to FTP it is not the same and is derived from your fitness signature as I understand it. So yes 4 hours at TP is likely not sustainable.
I’m not sure how this came to be. The idea is that FTP is sustainable for one hour. Already, that’s not quite the case, as it (wildly) varies between athletes, from 40 to 70 minutes or so. However, although I’m not sure if, with that ‘one hour’ do they mean ‘and that’s it, your dead’, or that you can repeat that hour after hour. I think we all know that’s not very likely.
Now, Xert’s TP is not the same as FTP, but often called ‘similar’ - that could imply that it actually represents a (different from FTP) value you could be maintaining ‘forever’, but I think not even Xert’s own staff believes that and it would probably be too much of a coincidence that TP actually is pretty close to FTP for most.
Plus, there’s LTP, which would be the value you could maintain - for a long time, but still not forever…
Thinking about this more after I posted, I believe the reality is TP and MPA are more a ceiling than what you are experiencing at any particular moment. Fresh and feeling good the model should be close but as the ride drags on your TP will approach LTP (and I’m sure MPA/HEI decrease as well). The model doesn’t factor this and I can kind of understand why - it depends so much on nutrition, how trained you are and such that it would be very hard to model accurately (let alone bonking or whatever). I do however feel it could be modeled in assuming proper nutrition, hydrating, and training to the point the numbers at least seam feasible.
As you discovered Xert doesn’t work without power data and that means weeks or months of historical data available. All rides should be recorded with power and synced to Xert…
Since you didn’t have that data when starting the trial my suggestion would be to sign-up and subscribe for at least 4 weeks. Then you’ll have sufficient data to establish a fitness signature and you can use Xert as designed.
Do you plan to use a trainer for any workouts? (dumb or smart)
I have a “smart” trainer with power reading but not control - the power is velocity based however so it’s smoothed and delayed to the point it’s not that useful outside sustained efforts. With that XERT estimated my peak power WAY low. Up until a week ago thats the only power data I had. I picked up a left arm only stages meter so can get better power readings on the trainer and on bike (at least my gravel/road/trainer bike). MPA went way up but TP down a bit on my first power recorded ride.
But yes, these limitations I understand, it’s what the model predicts late in a long ride I have issues with (the 4 hour @ TP workout really shows this). I’ve been training for the BWR (pushed to November now) so I’d like useful numbers many hours into a ride also.
Jumping into the workout designer and hoping to understand the principles is likely to generate more questions than answers.
As a baseline you need enough data to generate a valid fitness signature. Then you can play around all you want. Dialing in your signature will require a BT (breakthrough) ride or two whether it’s trainer based or outside following the workout guidelines, or a group ride that includes some hammering and a sprint.
As far as “useful numbers many hours into a ride”, IME the system just works. I assume because fatigue is factored in.
I know all that and I agree. However, there is doubt about how TP/MPA validates over time. I get that creating a 4 hour 100% workout is not your typical training, but I think you will agree that the fact that MPA doesn’t buckle one bit, is also strange. If you want to see a prediction on what your numbers will look like, 4 hours into an activity, it doesn’t help.
Excellent questions, and the discussion has been really good so far. I also just want to chime in with some thoughts & comments from our end at Xert.
By definition, threshold is the highest power that you can sustain that results in no net change in MPA (i.e. MPA will neither drop nor recover while riding at TP). As @Cyclopaat has already mentioned, for many athletes, the TTE at Threshold Power is typically around 40-70 min.
DS is an EWMA of XSS/hr with a time constant of 30 min. Since riding at threshold (with MPA = PP) is 100 XSS/hr, the difficulty will likewise top out at 100. If you try changing the workout to 4 hours at 101% TP, you’ll notice that this will change things a LOT.
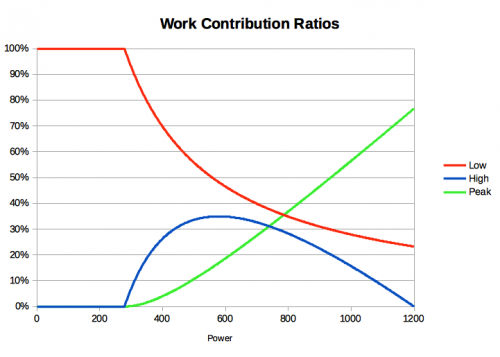
As of right now, all XSS below TP is considered Low Strain (you can see that in this image, taken from our blog post on Work Allocation Ratios). Notice that below TP (250W for this athlete), it is 100% low strain:
However, its entirely possible that we haven’t fully modeled this correctly, and that there may actually be non-linear allocation of high (and even peak) strain when riding below TP, which would align with why some athletes find Sweet Spot training so effective.
It IS entirely possible to hit MPA & get a breakthrough 4, 5 hours into a ride (I’ve seen plenty of times), but it does require very conservative use of hard efforts earlier in the ride, as well as adequate hydration and nutrition throughout the ride.
Hope this provides some additional insight. Cheers!
How Is long term fatigue accounted for? The idea of LTP and energy decline makes a lot of sense to me, I’m just not seeing it actually applied to a workout.
I am fairly new to endurance riding and am pushing myself way outside what its accustomed to in these 4+ hour rides, so the fact that my performance is dropping drastically late in a long ride (more than the model says) is not a huge surprise. What is a surprise to me is the model seems to suggest that if I just break a few minutes to let my HIE fully recover I’m back to 100% which we all know is not true even if I was a pro.
I’ll also say that long term fatigue is piling on me more in one of these long rides than would normally be expected - that is the sheer amount of XSS (350 on the latest) for my level of training (40) leads to drastically more long term fatigue at the end of the ride than what I started with which is outside the realm of normal. Given a more typical workout for the level of training the long term fatigue is not so different between the start and the end of the ride so it is maybe insignificant?
As I train and improve my fitness and get more power readings and such I’m sure the numbers will start making more sense.
That makes sense, as you are stretching such an activity beyond your normal ones.
However, it’s intensity that puts a cap on how long you can maintain it, not your TL/fitness. Sure, better fitness implies a higher hardness level, but I’m at 110 and I can assure you, I still cannot ride endlessly at TP level.
I am interested to know about it more too. Maybe Scott can share his knowledge, ideas with us. I always felt impact of longer endurance ride (4 hours) with IF 0.65 more than 2 hours hilly ride with IF 0.9. Its not easy to calculate for low stress fatigue, because it can relate not only to fitness level, but bike fit position, hydration, food, pedaling efficiency, athlete type (fast/slow twitch) too.
I remember hearing in one of podcast, that LTP feels like TP when Endurance Energy is depleted.
In reality, we know that your ability to generate work above TP is compromised by glycogen depletion, calcium fatigue, and general fatigue of fast-twitch fibers themselves. To complicate the matter, you have all mentioned how nutrition and hydration will also play a role in your ability to perform after longer rides.
What LTP is meant to represent, is the lowest your TP will decline to, even after riding for several hours. What this means is that holding LTP near the end of a multi-hour ride might feel comparable to trying to hold TP when you’re fresh - not too hard, but certainly not easy. One of the many challenges that comes into play with implementing long-term fatigue is that TP, HIE, and PP do not deteriorate at the same rate, nor to the same amount. For example, since PP efforts are mostly fueled by PCr, your PP will actually be (relatively) unchanged, even after multiple hours - the only reason I can think of off the top of my head why it would decay would be fast-twich fiber fatigue. On the other hand, HIE is likely going to be affected the most by long term exercise, due to glycogen depletion and muscle fiber fatigue. The result is that your HIE capacity would decrease, indicating that MPA would drop more quickly for an effort that is XYZ watts above TP, when compared to being totally fresh. Finally, TP will decline, but it will reach a point where it could (in theory) be fueled aerobically by fat oxidation, so it will only decay so far. So, clearly many things to take into consideration (which is bad for modeling - generally keeping fewer parameters in the model is better) and I haven’t even mentioned the mental aspect of things…
I think the fact that we can model performance as accurately as we have so far is a step in the right direction. I think solving this would also be the holy grail of endurance performance.
Thank you for the explanation, I’d really love to have deep understanding of how all this works to fully optimize my training (to the best we understand). This actually is the place I’m not totally satisfied with xert so far - I think the pieces are here but it’s not all exposed or in the case of this discussion subject not fully modeled in (at least in a workout). I get it that most people don’t want to geek out on the details and just want straighforward advice, geeking is my nature however.
I’m looking at this now: http://baronbiosys.com/fat_and_carb_utlization/ - can you explain how that relates to this fatigue we’re talking about and the work contribution ratios? (feature request: I’d love to see these curves generated for my signature) I’m also interested how those change with fatigue.
I’m picturing MPA like a water tank with a float at the top (supply) - As the demand ramps so does the supply flow to match but it hits max flow at TP after which the level will start dropping. The lower the water level the less 'head pressure" so max flow out the bottom decreases as the level gets lower which eventually only matches what the float is pushing out when the tank is empty. As the time drags on the pump pushing water up gets tired so supply flow decreases eventually to the point it can only keep up at LTP, adding to the issue is the float also gets tired and sags to a lower level so the tank holds less max water.
Anyways, Interesting discussion. Thanks for the insight!
-Jeff
To be fair…is anyone even remotely close to having this modeled? The fact that we have users that are requesting accurate MPA hours into a ride just means that we’re on the right track. Further, if you were to get a BT 5 hours into a ride…which parameters change? TP? HIE? Endurance Energy? How much do each weigh in? Hopefully the discussion brings forward some of the many challenges that go into trying to model this.
Even if we started to model this out and projected MPA hours into a ride, users may likely consider the MPA value displayed too high or low (based on their
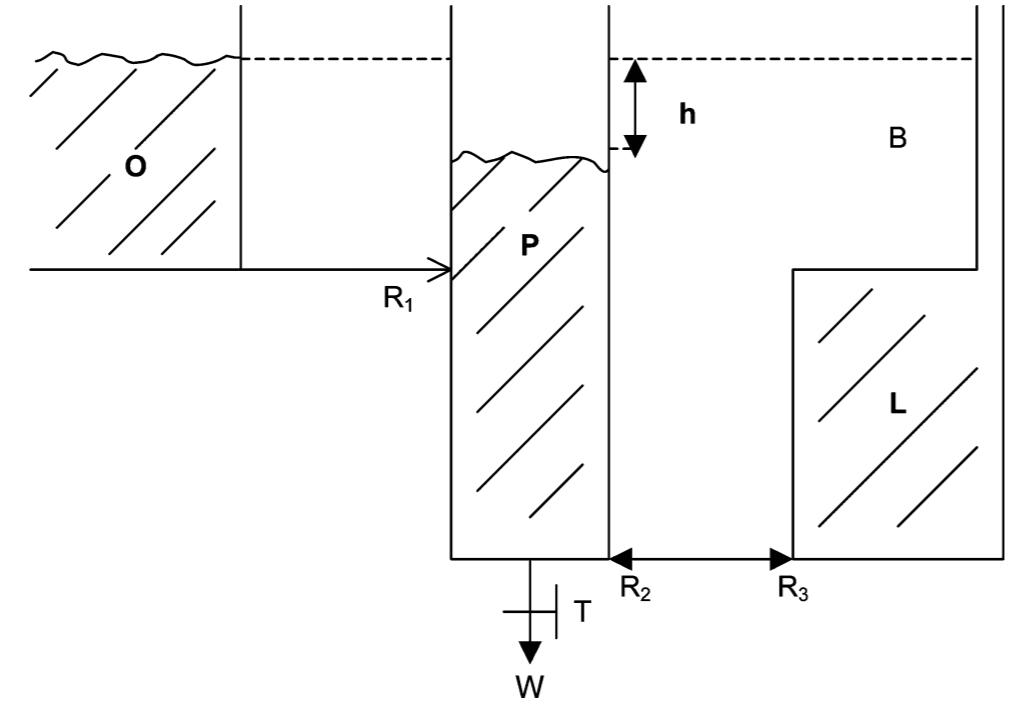
You would really find some of the papers written by Margaria & Hugh Morten in the 1970’s/80’s rather interesting. They were the first to start conceptualizing and developing a human bioenergetic model, which was comprised of 3 “tanks”, including Oxadative Metabolism (Fat & Carbs), Alactic Phosphoragens (i.e. ATP, PCr), and lactic (glycolytic - anaerobic carb) metabolism. They also defined the rate of water flowing out of the tank (W = total work being performed) as well as the metabolic rates of aerobic/anaerobic metabolism R1/R2 - there’s an exeerpt from Margaria’s work in the screenshot below.