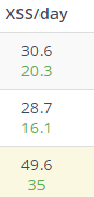
I cannot figure out, what is meaning of green figures below xss/day in weekly stats?
Hi Danny,
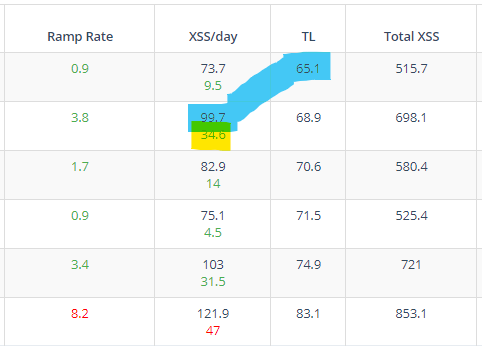
As with some of the other things in the system, these numbers preceded the Adaptive Training Advisor, which calculates much of this behind the scenes. Essentially, the smaller number under the XSS/day is the difference between your TL at the end of last week, and your average XSS/day for the current week. When you’re looking to steadily progress, you want this number to be slightly positive (how positive depends on Improvement Rate). In the screenshot below, notice the relationship between that smaller number and the Ramp Rate.
What you want to avoid, or be cognizant of, is large swings in one direction or the other, i.e. overtraining, or not training enough to keep progressing. Now, the XATA is designed to calculate this information for you, as well as pace your training to keep you on a steady, even progression. Hope that makes sense!
1 Like
Hello Scott,
makes perfect sense, its similiar meaning as IR, but not exactly the same, its interesting to look at same thing just from different angle.
Thanks a lot!