Xert Breakthrough TP vs Ramp Test discrepancy

If Xert doesn’t use a power-duration curve, then why would it be “good” to have BT’s at a couple of different points? What purpose does it serve if it’s not to complete the curve? You write “it looks for patterns of fatigue in your power data (through the use of MPA) and uses those to determine all 3 parameters of your fitness signature.” Can you please explain in detail what this means? Thanks…

A power-duration model looks for your “best” X, Y, Z min power and creates a curve through those data points. Xert’s power curve isn’t based on your best XYZ min power, but rather derived from your fitness signature, using MPA. Many times your best/maximal efforts aren’t perfectly paced 3 min, 5 min, etc. efforts, especially when you consider group ride or race data!

The various efforts still “complete” the curve, but not in the same way. It’s because each signature parameter has greater influences on various parts of the power curve (e.g. Peak Power has the greatest influence over the 1-15s range).

TLDR - You need an accurate fitness signature to get an accurate power curve. Since each of the 3 signature parameters influence different parts of the power curve, getting the most accurate curve will occur when maximal efforts are seen at a couple different durations.

Hope that makes sense!

1 Like

Still confused. Xert needs three good points. The others need points in order to draw the most accurate curve, and hence derive FTP from a point on the curve at around the 60 min mark. I guess some algorithm is used for the equation that defines the curve, based on those three points. Is this how the others estimate FTP?

How is Xert different? You write:

“The various efforts still “complete” the curve, but not in the same way. It’s because each signature parameter has greater influences on various parts of the power curve (e.g. Peak Power has the greatest influence over the 1-15s range).”

That seems obvious. If I do a 3 min 45 sec best effort, then the corresponding point would be the intersection of a vertical line from the 3 min sec point on the x-axis, drawn up to the computer curve. How is that different from what the “others” do?

“You need an accurate fitness signature to get an accurate power curve. Since each of the 3 signature parameters influence different parts of the power curve, getting the most accurate curve will occur when maximal efforts are seen at a couple different durations.”

This sounds like exactly what the “others” do. You worked in MPA in an earlier post. How exactly does MPA work into the process? For me, your explanations of the two methods seem the same, except for some vague incorporation into the explanation of MPA.

rega

Hi Carmen,

Sorry if my explanations aren’t clear - hopefully I can make it more clear. It’s a subtle but important difference.

I think you’re already aware, but I’ll highlight anyways that Threshold Power in Xert =/= 60 min power, although they may often be very close (perhaps a separate thread).

It is possible to derive an athlete’s entire signature from a few supramaximal sprints, but it becomes a little dangerous to extrapolate TP from those efforts, since your Low Energy System (Threshold Power system) contributes so little work to the sprint. Conversely, it’s possible to fit almost an infinite combination of Peak Power/HIE values to a 20 min effort to failure, since they contribute so little work to 20 min power. To conceptualize this, think about an athlete with a Peak Power of 1800 W and an athlete with 600 W Peak Power who both have the same 20 min power.

Having an idea of the athlete’s peak power is important because it sets the “starting point” for MPA (when fresh, MPA = PP). From there, HIE and TP will influence how MPA decreases and limits your power output as you perform harder efforts, which I’ll elaborate on below.

Its true that many times Xert users will see a BT effort at the end of an all-out effort like you described, but what if the effort isn’t steady state? I.e. 20/10’s, 20/20’s, 30/30’s, race data, etc. Or, what happens if you had a hard effort and then finished the effort with a sprint? Or, what if you weren’t completely recovered from previous efforts when you started your maximal 3 min effort? The Mean Maximal Power data doesn’t capture those finer details - since it’s looking only at the average power over that period and plotting it.

What Xert does differently is look at the Maximum Power you could generate (MPA) and your power output, second by second, and identifies places where they interact, specifically during maximal/breakthrough efforts. We can then determine the athlete’s fitness signature by maximizing the time that MPA and power interact, without Power ever exceeding MPA. In this way, the resulting signature isn’t affected by the mean power of a maximal effort, but rather how the effort was limited by MPA.

Once we know the signature, we can then create a power curve that shows the maximum power that is achievable for any duration (assuming perfect pacing) from your signature & MPA - rather than fitting a power curve through the mean maximal data that you have done in the field.

Hopefully that’s a little more clear?

2 Likes

Ok, so basically you’re saying that playing around with MPA allows you to create a fitness signature, a power curve, even in situations that aren’t maximal efforts. That’s what you said, correct?

So if that’s true, then it follows that one can bring down that MPA line (as your graphs show) down to touch the power output curve of the workout, without the effort being a maximal effort. That would be great. Can you show me any example of that happening, maybe a fit file or something that illustrates a breakthrough during a workout that happens not to be a maximal effort?

Sorry if that’s what was understood. Certainly a maximal effort is needed to generate a BT!

What I mean is that your MMP data only captures what you’ve done - it can’t show would be possible for you. If your 3:45 effort was paced perfectly to the watt at exactly the maximum that you can maintain for 3:45, that’d be perfect. But many times, Breakthrough efforts are performed without being anywhere near your best MMP. And that using only MMP will miss data points where you performed an amazing effort that was performed under fatigue, which compromises your ability to generate power. IOW, it might not be your best MMP data, but after considering previous fatigue, we can show that your fitness improved, even if the effort wasn’t your best ever XYZ Mean Max Power.

I like examples! Great idea!


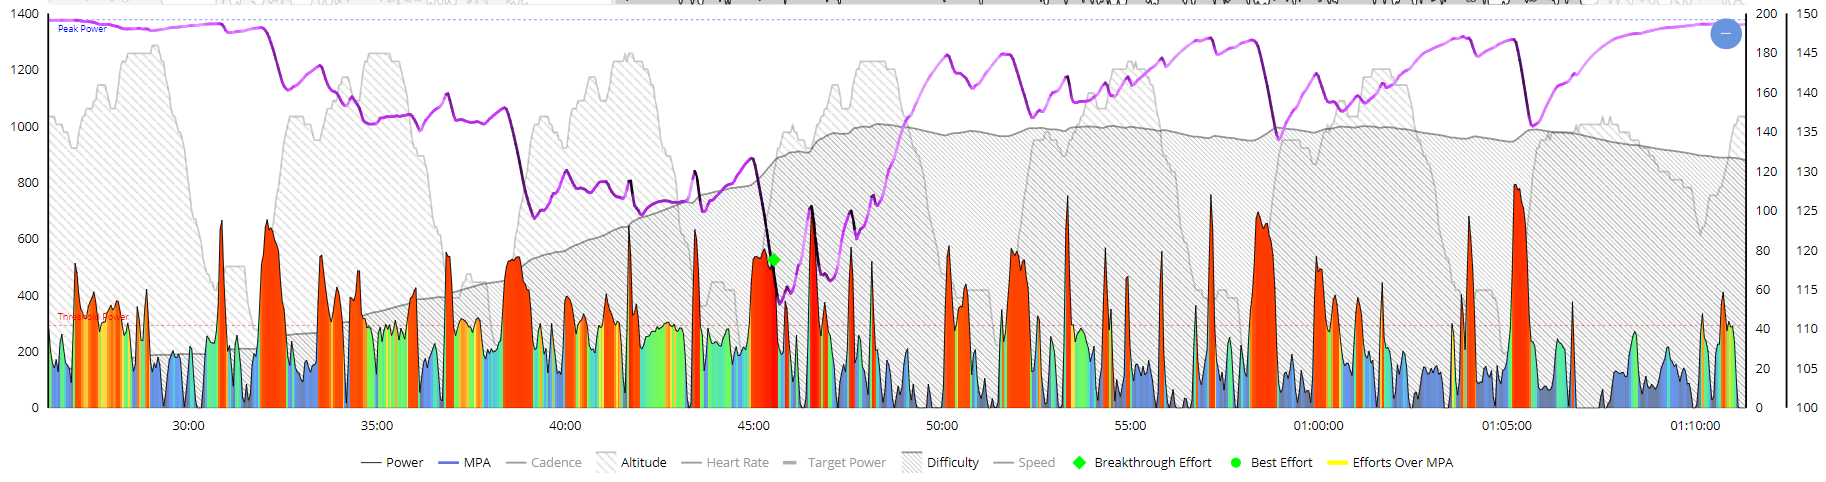
This was a group ride/race which consisted of 5 times around a loop which included a hard ~45s climb. The effort identified as a BT in the center of this activity was nowhere near this athlete’s best MMP on their PD curve (or even their best MMP of the day), but still represents a maximal/breakthrough effort because of the fatigue that had already been accumulated from the previous two laps.

Using only MMP, you’d never ever catch this, or identify an increase in fitness from this ride:


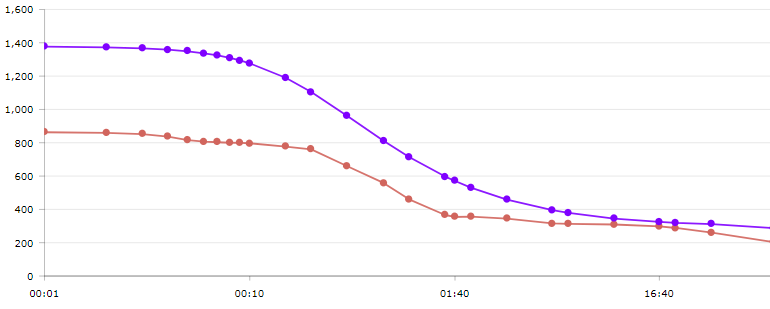
Here is the Power Curve from the activity, showing the athlete’s actual MMP from the activity in Red and their Modeled Power Duration Curve in Purple (derived from their fitness signature). As you can see, this athlete never once got close to their ‘best’ MMP but we were still able to detect a 10W increase in Threshold.

Hopefully a helpful example. Cheers!

1 Like

I appreciate your taking the time here. Still hazy. Your last post begins by saying:

“Certainly a maximal effort is needed to generate a BT!”

If that’s true, shouldn’t that red curve have a point on it above the purple curve specifically at the 45s mark on the x axis? Maybe I’m misunderstanding definitions. What do you mean by a “max effort?”

I have plenty of instances in my history of ramp tests and 20 minute tests that have resulted in a breakthrough.

The standard final minute power x 0.75 and 20 minute power x 0.95 are way off the mark for me. They give FTP values that put my training zones out by a whole zone.

Breaking Through the Xert Way! – Xert (baronbiosys.com)

There are different types of max efforts

  1. according to the power-duration curve exactly i.e. you hold your 4MMP for 4 minutes - that’s a max by definition
  2. you reach failure in some other other way - it’s still maximum in that you couldn’t have done more, but doesn’t touch the curve per the example above

Another simpler example would be say you

  1. hold 4MMP for 3 minutes (so not a max on the power curve), THEN
  2. (try to) hold 10MMP for 4 minutes directly after that (also not remotely near a max on the power curve… so the combined effort would also not be a max on the power duration curve)

That would actually lead to a breakthrough under XERT (at least for my signature), which you can see by creating a dummy workout (where MPA crosses power), but wouldn’t trigger anything under ‘other’ systems as they’re referred to:


The reason is that the XERT also takes into account fatigue from the first ‘near max’ effort in assessing the overall impact of the second ‘near max’ effort. You can clearly exhaust yourself by riding at intensities below the power-duration curve

2 Likes

Definitely a paradigm shift in our understanding of exhaustion/maximal efforts. From here forward, a maximum effort is any point where your power output reaches MPA.

I think what’s confusing is that using MMP data will only catch certain maximal efforts - mainly those efforts that are done while fresh until a point of failure is reached, like this:
image

Xert is able to catch a whole variety of other maximal efforts that would normally be completely missed because we aren’t looking at the average power over some duration, but rather the power that you’re producing every second, such as the example provided earlier.

1 Like

Here’s another example from the Workout Designer:

  • 500 Watts for 30 seconds
  • 200 Watts for 30 seconds
  • Repeated until failure. In my case that’s at 4:24 with an average power of 363 Watts.

Now look at a constant effort at 363 Watts. Failure this time happens at 6:10. Quite a difference even although both took you to the point of failure.

The first effort would be sub maximal as far as the MMP curve is concerned as you can hold the same average power for 1:46 seconds longer but in Xert the effort is captured and reflected in your Fitness Signature and the Power Curve that is generated from that.

Mike

2 Likes

Yeah, my 363 watt sustained efforts usually fail around that point… :rofl:

Not sure I should post that but my Xert thinks I would last about 30 seconds :wink:
But I guess that’s the beauty of the system: It really adapts, even to me :flushed:

interesting stuff Scott. What I think is my understanding of the differences between MMP curve data and the MPA/ Hie, TP triad is that with MMP all of these points on a curve have to be under ideal conditions, ie rested, fuelled etc. What Xert does is is completely different and a bit hard to wrapp your head around because there is a fair bit of math under the hood, but it looks at the current situation for that athlete (how fatigued they are for now) based upon what has happened up to the time of the effort. It has calculated how much effort you should have available, call that MPA, and then based upon what you actually do decides if you broke through that limit. If you broke through what your signature thinks (calculates) as you limit then something has changed and often the something is your TP, but it may also be your MPA or your HIE since (though on this point I am fuzzy) they interact.

So break through effort is a much more complex item and why I like XERT because as you get your signature dialed in you have harder and harder work to break through indicating to me you are on a plateau, if break throughs are too easy to achieve there is something that needs to be tweaked in your signature and that happens over time it will eventually dial itself in and all is good.

So it is a very different head set and takes some getting used to. This is what I see as the biggest hurdle that XERT has to get people on side and committed users…

The otehr thing I love about XERT is the smart workouts. This again is based upon an accurate signature but if so then you should not fail to complete a workout if your signature is dialed in or there is something that is impacting your ability to perform that can not be reflected in the signature, like external (work/ life) stress, poor nutrition or fuelling etc.

Scott, Stephen, and Armando, keep up the good work I can’t wait to see where this goes from here.

3 Likes

Thanks, now it’s making sense.

1 Like

Long standing question for me: is it maximal effort time on the Activity, or the maximal effort time at the previous sig? Example would be, I’ve got :28 on the activity, but if I hit ‘Previous’ it’s 1:13.

You tell me. :smile: We figured your fitness had changed before the ride and not during the ride hence the maximal effort is measured with the new signature.

Ha! Sorry, didn’t make that very clear. What I should have said was, I love the idea of looking at maximal effort duration as indication of how ‘good’ the BT effort was. So… when @ManofSteele says ‘1:00 maximal effort time is excellent’, would you base that on what we thought the sig was, or what we now know it is? (I’m thinking it’s on the ‘out of date’ sig).

The out of date signature, is actually your predicted signature with a slight downward adjustment in order pick up variations. If we had perfect data and everything was tuned perfectly, we would predict your signature and you’d never get a breakthrough. :frowning_face: but you’d still have maximal effort time. It would just never generate a breakthrough.

The more time you spend near MPA, the clearer the picture becomes on what your signature actually is. It needs to be on what we now know it is because the out of date signature may have you spending minutes near MPA but after the signature is obtained, it may only turn out to be a few seconds. This is often the case with long efforts just above TP. A small change in TP makes a big change in MPA and so you may go from minutes to a few seconds after the adjustment.