Has anyone attempted to align testing such as ramp tests with TP? I have used workouts like Cheung Ronnestad to achieve breakthrough by turning off erg at the end and just going as hard and as long as possible. These TP calculations seem to align well with actual performance on real rides. TP is a bit over 250 at this time of year and seems pretty close.
I also tried the ramp test. Created a workout that ramps up 20W per minute.
Traditional 75% calculation for ramp test says I should get to about 335 for a 252 TP. Xert says I need get to 365W for a 252 breakthrough. In my real test I got to 338 which aligns with the traditional 75% rule and gives me a 253 TP. Xert says that I was nowhere near a breakthrough. Extracting TP from the ride, Xert came up with 220.
You don’t even need to ride to see this difference. You can see it in the workout designer. Is there something about Xert calculations that are incompatible with something like the ramp test? In short, I am unable to achieve a breakthrough using a ramp test. Is anyone seeing a similar thing?
I can’t get breakthroughs with traditional ramp tests either. I like the Ronnestat workouts - I think they are better at detecting breakthroughs because it gives the xert model more information to work with since you’re giving it more time at your max effort.
Xert uses a completely different method to determine your fitness signature (that’s Threshold, HIE, and Peak Power), instead of taking %'s of a ramp test, or 8/20 min power. Also, the results of any ramp test depend on the protocols of the ramp itself (i.e. 20W vs 30W per step, steps every 1 min v 2,3, or 4 min, etc. etc.), so hard to know which version of the ramp you’re doing.
Finally, traditional ramp tests can’t account for contributions from anaerobic sources… suppose two athletes have the exact same threshold power, but two drastically different HIE’s. The athlete that has the larger HIE will push farther on the ramp test, since they’ll have a bigger contribution from anaerobic sources. The end result is that that athlete’s Threshold would be estimated, if both athletes had their threshold estimated to be 75% of the highest 1min power. Traditional ramp tests can’t pick up on this, so there is potential bias towards an inflated TP for athletes that tend to be more anaerobic.
As @alaskagriz mentioned, spending more time with your power output close to MPA will result in a more accurate estimation of your fitness signature, since Xert looks at how you fatigue in order to determine your fitness signature - the more/longer you can hold your power close to MPA, the better the resulting calculations will be.
Finally, doing a ramp test just one day after getting a BT from a Ronnestad workout is crazy I suspect you’d need more recovery before being able to push yourself to the limit again!
Quick question: what max effort time would you say is poor/fair/good for creating a sound signature? Or just, what is a “fair” max effort time assuming that 10-40sec is poor and 6min is good. The window between 30sek and 6min is quite big
the key thing I have noticed to nearly guarantee a breakthrough is repeated efforts that drag down you MPA but with not enough recovery in between to fully reset the MPA so that it increasingly is depleted until the last effort takes you into the breakthrough. I have a workout that in 4 efforts the last one (a full on sprint in slope mode) will nearly guarantee a breakthrough for my signature. I also see the same outdoors, I have a hill with repeated efforts, the hard part of the hill drags my MPA down to a significant amount, the recovery is not enough to reset it and the second effort is often a breakthrough. So I think it probably depends on your signature what sort of efforts will cause a breakthrough. I can never get a breakthrough on a single long effort, I reach failure but there is still MPA room and I can not make it to breakthrough.
The need for repeat efforts to drop MPA before going for a breakthrough is my experience as well. While I did the ramp test the day after Ronnestad, I was quite fresh. I can tell from my HR that I was at my real limit. When I’m tired, my HR just doesn’t go up.
As noted, taking the results of my ramp test and doing the traditional calculation of 75% ended up with a TP that was exactly the same as the Ronnestad the day before. Maybe creating a modified ramp test that is multiple shorter iterations to drop MPA before a final effort for breakthrough. With the workout designer it is easy to model when a breakthrough will occur. However, there are multiple other workouts already designed to get a breakthrough in Xert, so not sure there is anything useful to gain here.
Any maximal effort time < 15s is generally not too great (with the sole exception of a pure, PP breakthrough). There’s simply too many variables that could contribute to that effort that it’s hard for the system to pick out exactly what the contribution from TP, HIE, and PP is. That’s why I often refer to single sprint BT’s as being ‘cheeky’.
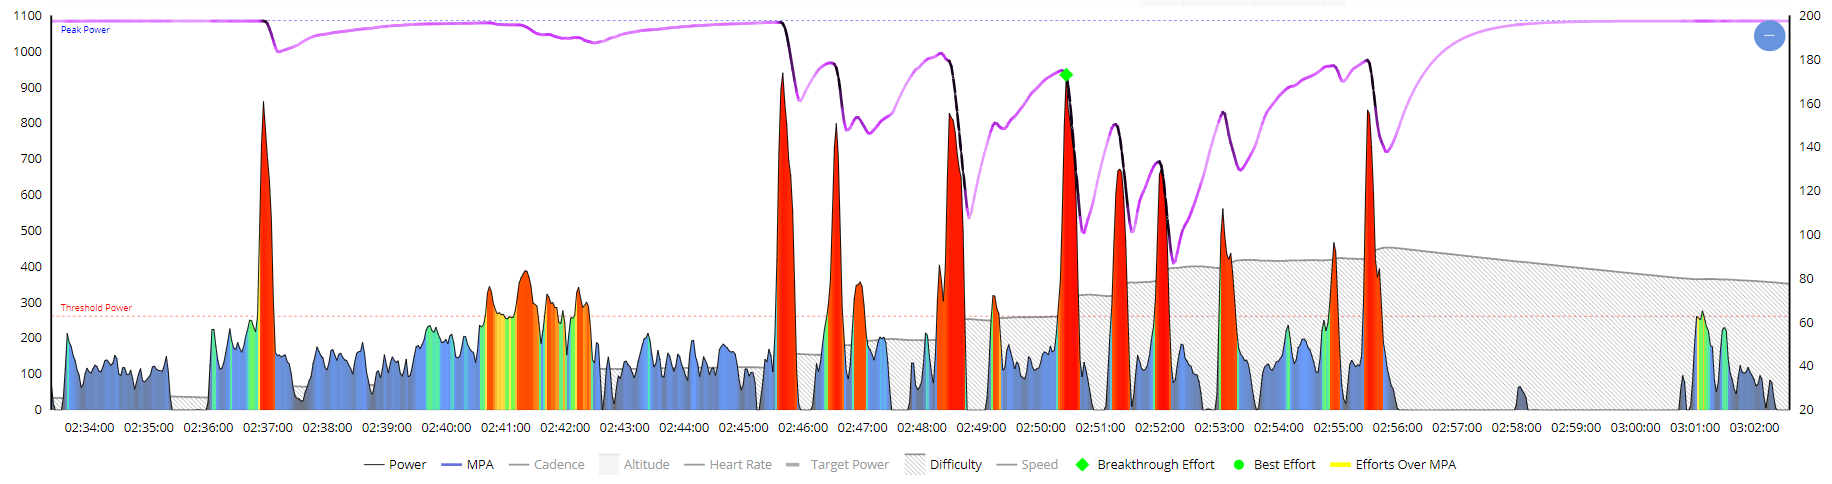
However, if you’re able to do that multiple times, Xert can start to hone in on the signature because it can track the depletion and replenishment of your MPA over a series of short, hard sprints. Take, for example, this BT effort I did on the road last summer. It was a relatively straight road with constant pitches up & down. I used my light weight and smashed each time we went up a hill, and let MPA briefly recover before doing it again, and again, and again… I was still able to manage 0:56 of maximal effort time, just in these short sprints. With only doing one of those sprints, I wouldn’t ‘trust’ the result of the breakthrough as much as I did after having pushed several times.
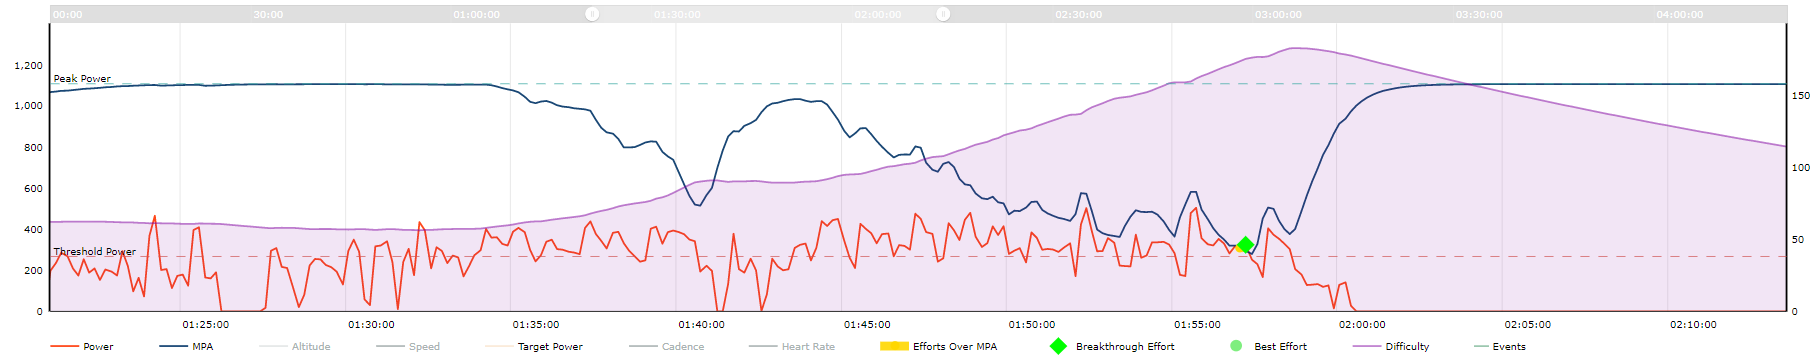
Secondly, you can also sprint & then keep going (aka ‘hold on for dear life’) to increase the maximal effort time and get better results from the signature parameters. Not quite a perfect example, but it provides a slightly different perspective on BT’s (on that doesn’t involve ON/OFF efforts…). In this example, a buddy was on a solo break and trying to beat a small chase group back to the start of the ride. This was about 30 minutes of at-the-limit riding from him:
TLDR: Anything over 1:00 maximal effort time is excellent. The more time you can spend at/near MPA, you’ll get a better estimation of signature parameters, but keep in mind that you’ll have a higher strain, difficulty, XSS, etc.
Well, Xert doesn’t use a power-duration curve like every other power model on the market. Instead, it looks for patterns of fatigue in your power data (through the use of MPA) and uses those to determine all 3 parameters of your fitness signature. You are correct though, it’s good to have BT’s at a couple different points to ensure a well-rounded signature.
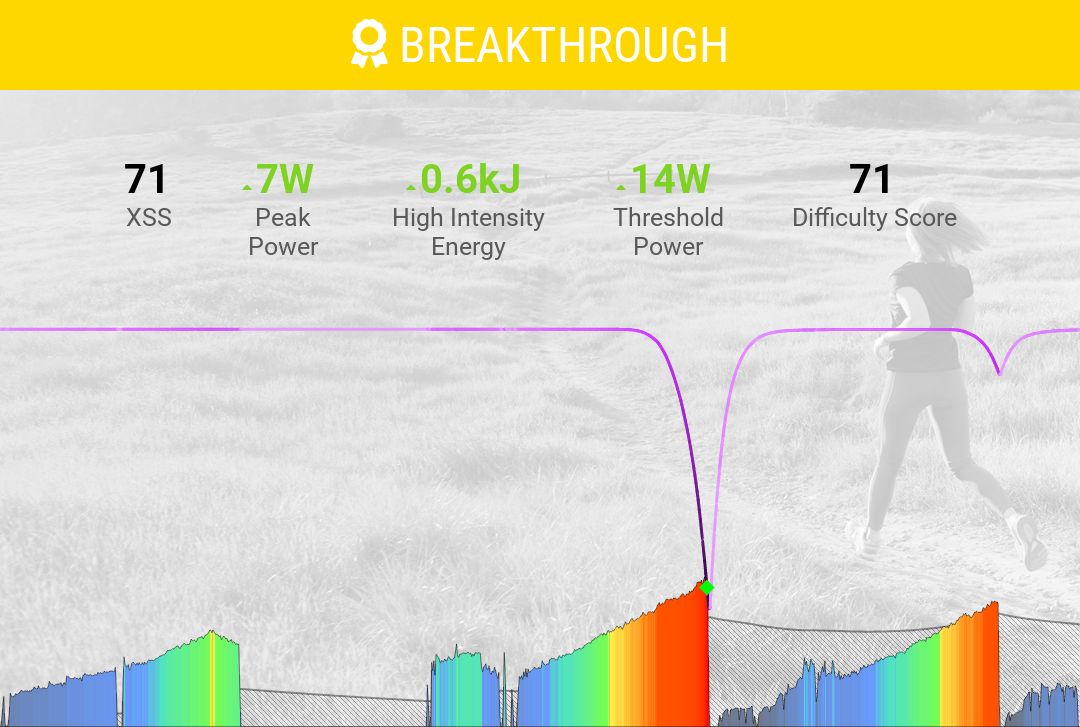
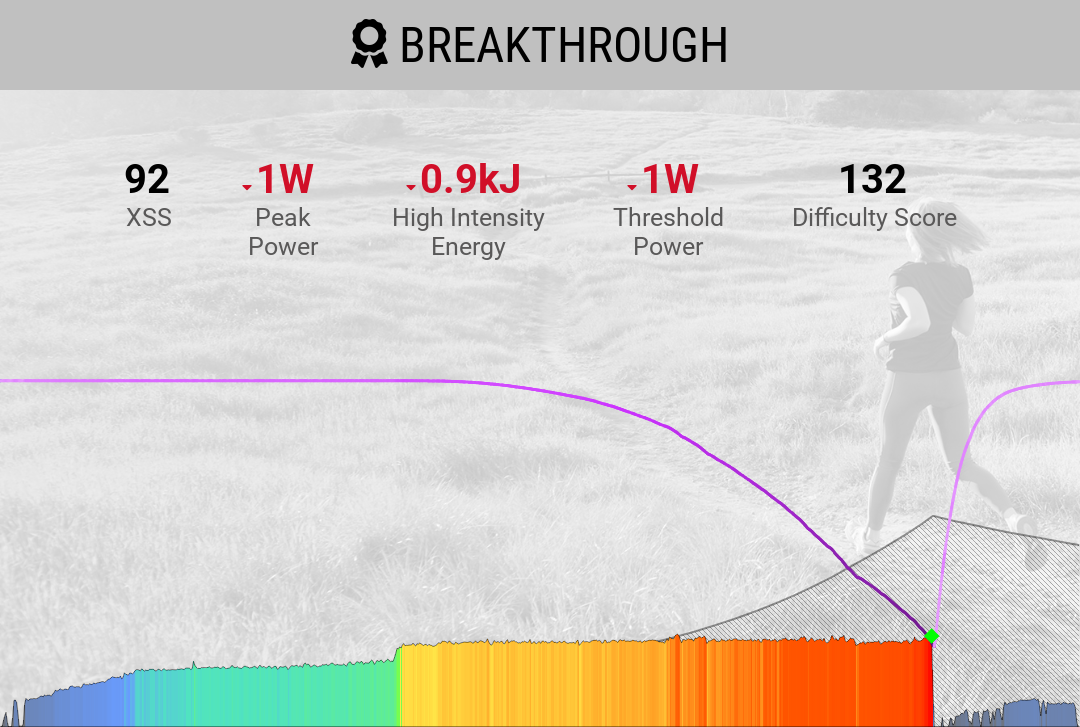
Your two charts demonstrate that your signature was invalid during the first workout.
If signature had been valid it would have been impossible to spend 10 minutes above MPA.
Now that your signature is corrected you should flag the invalid BT workout to remove it from calculations.
To be clear, by definition it’s normal to spend time above MPA when looking at the effort under the ‘previous’ signature under the advanced MPA tab (which I think is what you showed - same workout, different signature).
What is a little odd is the size of the breakthrough and amount of time you were above MPA, especially if your signature was not so old. It’s not necessarily this effort that’s incorrect - previous ones may have been instead, however if you have many previous BTs of a similar level, one may guess the most recent one has the issue.
I’d first want to get comfort that the powermeter is reading correctly over time - was it the same one you usually use? was it calibrated? is it a direct force power meter or estimated power from e.g. a wheel-on trainer (where tyre pressure and pre-load can make a big difference etc).
I’d temporarily flag it, and then see if you can repeat the same kind of effort after calibrating your powermeter. If you can, then un-flag again (and congratulations on the improvement!)… if you’ve trained a lot recently and were coming off a low base relative to higher fitness levels some time back, it is possible you’ve regained some of that fitness…
Last month I did 2 “BT fitness test under pressure”, one just before 4 weeks of Front Load Periodization, one just after. Both tests gave me 296W and 295W. Yet I wasn’t able to do the Seiler 4x8min workouts during the FLP at the estimated TP I was supposed to hold. I could only do the intervals 30W lower (first week at around 273W, last week around 290W) !
So…
If Xert doesn’t use a power-duration curve, then why would it be “good” to have BT’s at a couple of different points? What purpose does it serve if it’s not to complete the curve? You write “it looks for patterns of fatigue in your power data (through the use of MPA) and uses those to determine all 3 parameters of your fitness signature.” Can you please explain in detail what this means? Thanks…
A power-duration model looks for your “best” X, Y, Z min power and creates a curve through those data points. Xert’s power curve isn’t based on your best XYZ min power, but rather derived from your fitness signature, using MPA. Many times your best/maximal efforts aren’t perfectly paced 3 min, 5 min, etc. efforts, especially when you consider group ride or race data!
The various efforts still “complete” the curve, but not in the same way. It’s because each signature parameter has greater influences on various parts of the power curve (e.g. Peak Power has the greatest influence over the 1-15s range).
TLDR - You need an accurate fitness signature to get an accurate power curve. Since each of the 3 signature parameters influence different parts of the power curve, getting the most accurate curve will occur when maximal efforts are seen at a couple different durations.
Still confused. Xert needs three good points. The others need points in order to draw the most accurate curve, and hence derive FTP from a point on the curve at around the 60 min mark. I guess some algorithm is used for the equation that defines the curve, based on those three points. Is this how the others estimate FTP?
How is Xert different? You write:
“The various efforts still “complete” the curve, but not in the same way. It’s because each signature parameter has greater influences on various parts of the power curve (e.g. Peak Power has the greatest influence over the 1-15s range).”
That seems obvious. If I do a 3 min 45 sec best effort, then the corresponding point would be the intersection of a vertical line from the 3 min sec point on the x-axis, drawn up to the computer curve. How is that different from what the “others” do?
“You need an accurate fitness signature to get an accurate power curve. Since each of the 3 signature parameters influence different parts of the power curve, getting the most accurate curve will occur when maximal efforts are seen at a couple different durations.”
This sounds like exactly what the “others” do. You worked in MPA in an earlier post. How exactly does MPA work into the process? For me, your explanations of the two methods seem the same, except for some vague incorporation into the explanation of MPA.
Sorry if my explanations aren’t clear - hopefully I can make it more clear. It’s a subtle but important difference.
I think you’re already aware, but I’ll highlight anyways that Threshold Power in Xert =/= 60 min power, although they may often be very close (perhaps a separate thread).
It is possible to derive an athlete’s entire signature from a few supramaximal sprints, but it becomes a little dangerous to extrapolate TP from those efforts, since your Low Energy System (Threshold Power system) contributes so little work to the sprint. Conversely, it’s possible to fit almost an infinite combination of Peak Power/HIE values to a 20 min effort to failure, since they contribute so little work to 20 min power. To conceptualize this, think about an athlete with a Peak Power of 1800 W and an athlete with 600 W Peak Power who both have the same 20 min power.
Having an idea of the athlete’s peak power is important because it sets the “starting point” for MPA (when fresh, MPA = PP). From there, HIE and TP will influence how MPA decreases and limits your power output as you perform harder efforts, which I’ll elaborate on below.
Its true that many times Xert users will see a BT effort at the end of an all-out effort like you described, but what if the effort isn’t steady state? I.e. 20/10’s, 20/20’s, 30/30’s, race data, etc. Or, what happens if you had a hard effort and then finished the effort with a sprint? Or, what if you weren’t completely recovered from previous efforts when you started your maximal 3 min effort? The Mean Maximal Power data doesn’t capture those finer details - since it’s looking only at the average power over that period and plotting it.
What Xert does differently is look at the Maximum Power you could generate (MPA) and your power output, second by second, and identifies places where they interact, specifically during maximal/breakthrough efforts. We can then determine the athlete’s fitness signature by maximizing the time that MPA and power interact, without Power ever exceeding MPA. In this way, the resulting signature isn’t affected by the mean power of a maximal effort, but rather how the effort was limited by MPA.
Once we know the signature, we can then create a power curve that shows the maximum power that is achievable for any duration (assuming perfect pacing) from your signature & MPA - rather than fitting a power curve through the mean maximal data that you have done in the field.
Ok, so basically you’re saying that playing around with MPA allows you to create a fitness signature, a power curve, even in situations that aren’t maximal efforts. That’s what you said, correct?
So if that’s true, then it follows that one can bring down that MPA line (as your graphs show) down to touch the power output curve of the workout, without the effort being a maximal effort. That would be great. Can you show me any example of that happening, maybe a fit file or something that illustrates a breakthrough during a workout that happens not to be a maximal effort?
Sorry if that’s what was understood. Certainly a maximal effort is needed to generate a BT!
What I mean is that your MMP data only captures what you’ve done - it can’t show would be possible for you. If your 3:45 effort was paced perfectly to the watt at exactly the maximum that you can maintain for 3:45, that’d be perfect. But many times, Breakthrough efforts are performed without being anywhere near your best MMP. And that using only MMP will miss data points where you performed an amazing effort that was performed under fatigue, which compromises your ability to generate power. IOW, it might not be your best MMP data, but after considering previous fatigue, we can show that your fitness improved, even if the effort wasn’t your best ever XYZ Mean Max Power.
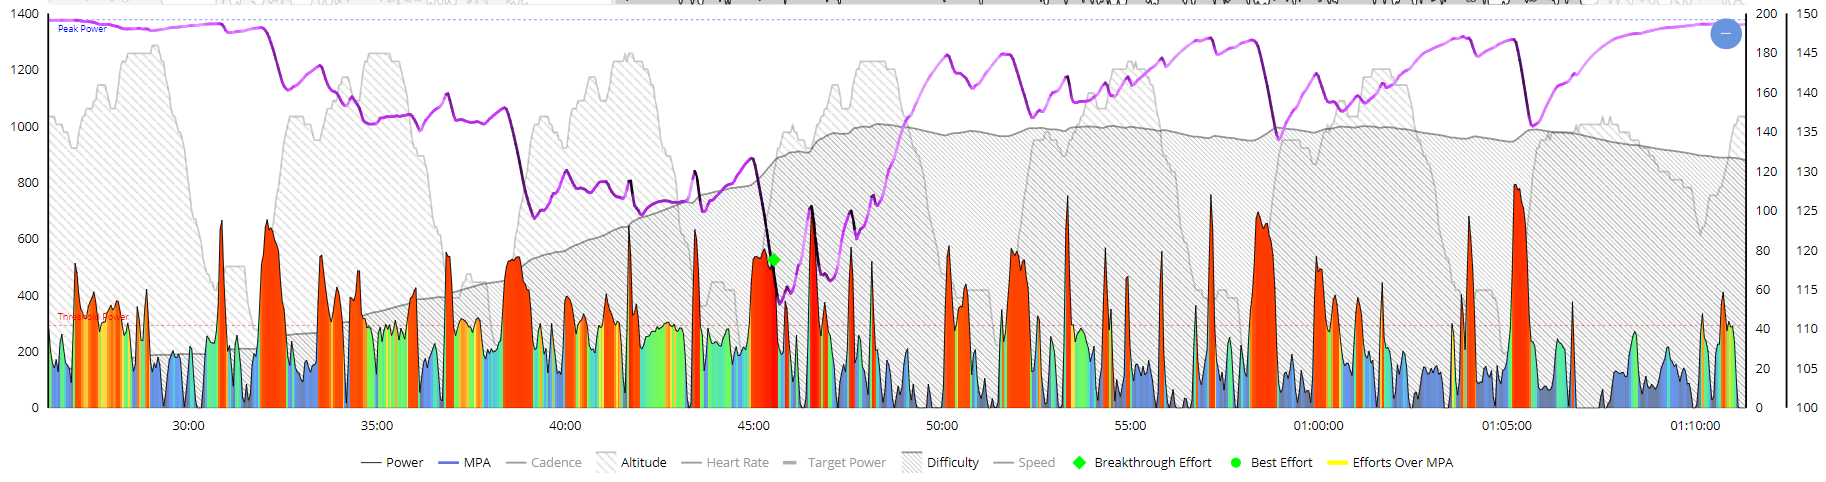
This was a group ride/race which consisted of 5 times around a loop which included a hard ~45s climb. The effort identified as a BT in the center of this activity was nowhere near this athlete’s best MMP on their PD curve (or even their best MMP of the day), but still represents a maximal/breakthrough effort because of the fatigue that had already been accumulated from the previous two laps.
Using only MMP, you’d never ever catch this, or identify an increase in fitness from this ride:
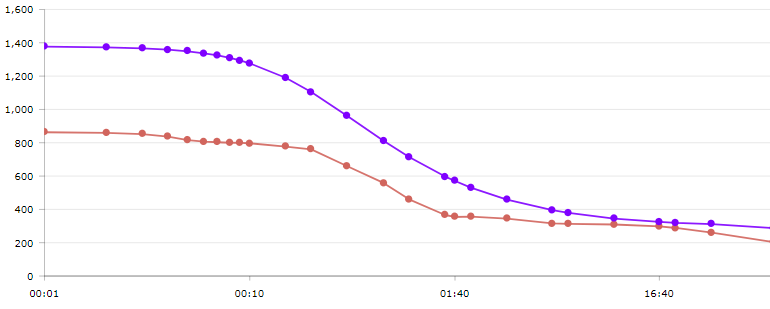
Here is the Power Curve from the activity, showing the athlete’s actual MMP from the activity in Red and their Modeled Power Duration Curve in Purple (derived from their fitness signature). As you can see, this athlete never once got close to their ‘best’ MMP but we were still able to detect a 10W increase in Threshold.
I appreciate your taking the time here. Still hazy. Your last post begins by saying:
“Certainly a maximal effort is needed to generate a BT!”
If that’s true, shouldn’t that red curve have a point on it above the purple curve specifically at the 45s mark on the x axis? Maybe I’m misunderstanding definitions. What do you mean by a “max effort?”
I have plenty of instances in my history of ramp tests and 20 minute tests that have resulted in a breakthrough.
The standard final minute power x 0.75 and 20 minute power x 0.95 are way off the mark for me. They give FTP values that put my training zones out by a whole zone.