I read the “Sweet Spot, Threshold and Polarized Training … By the Numbers” article with interest. It provides a way to determine optimal training regimes depending on observed fitness signatures. It uses the three primary values but also LTP. However, I don’t see where I can find LTP as a value anywhere on Xert.
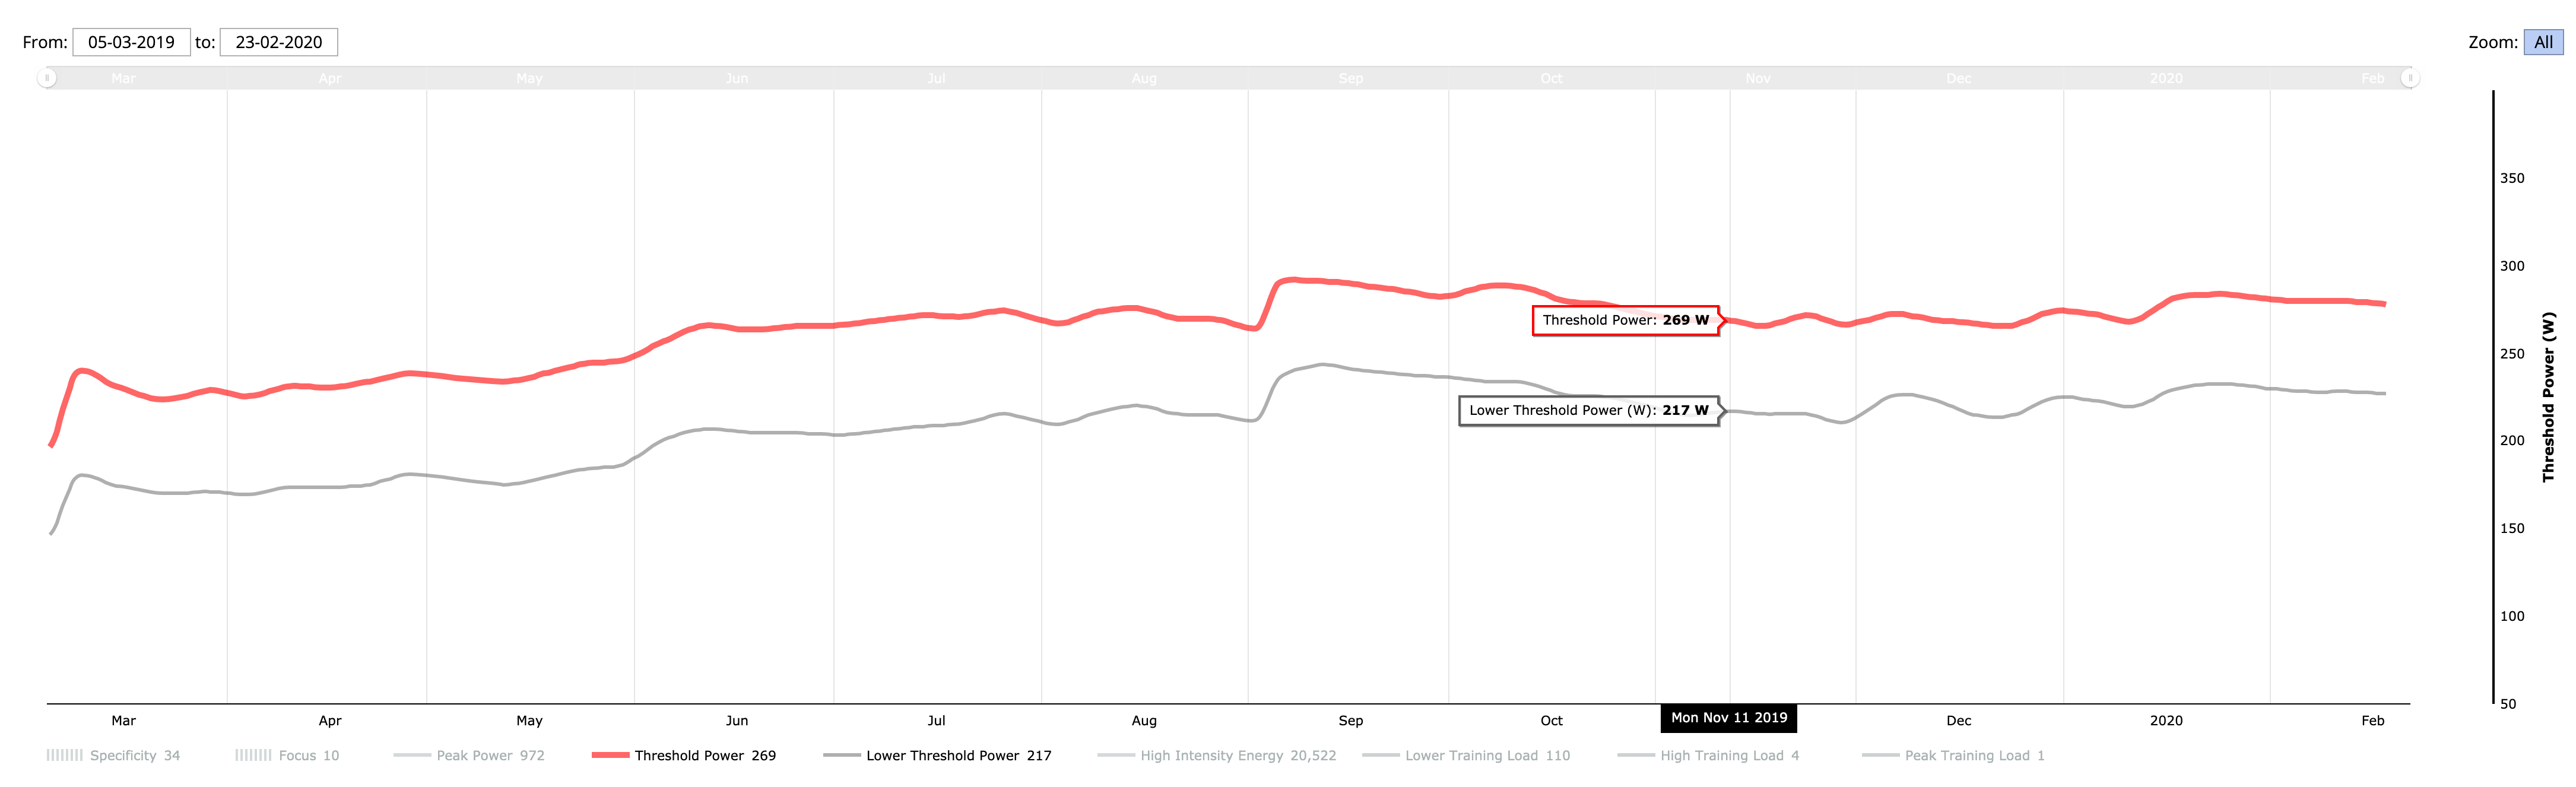
Good question. I have just spent some time searching for historical values but I cannot see anything. However I am guessing it is a variable that is quite easy to be calculated as my number is 216.6 which suggest it might be related to my current TP of 260.
Look at your and see if the relationship is the same. If it is you can calculate it based on previous TP as seen in the progress view.
I also would like to know what the equation is to calculate LTP but i’m guessing Xert doesn’t want to give that out. I do know that LTP is inversely related to HIE… in other words higher HIE means you have lower LTP…
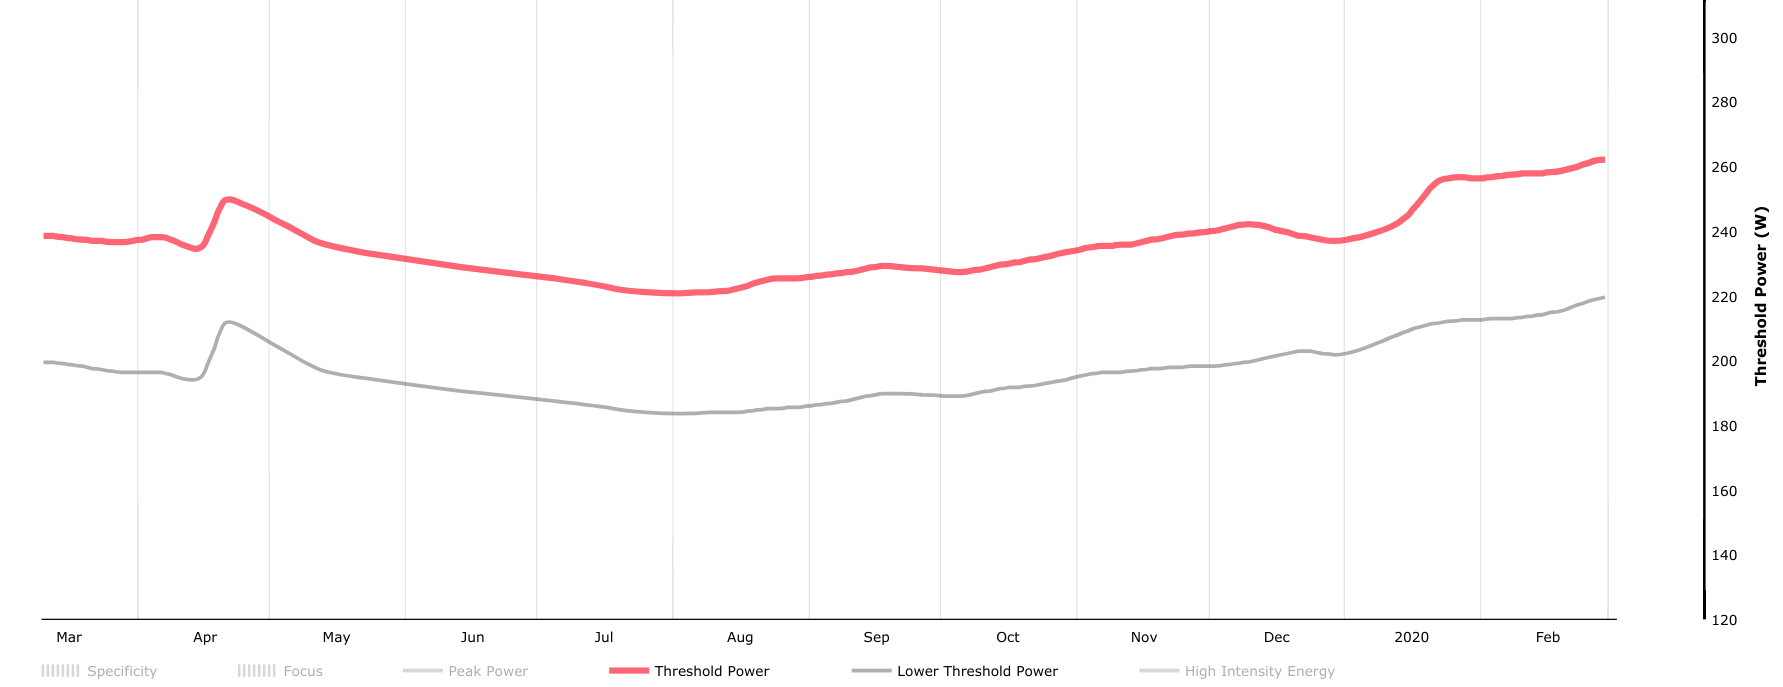
I must be misunderstanding this question. I can read the value of my LTP for any day in the past, from my fitness signature. It is obviously related to TP, but not entirely 1:1 as the curve shows…
wow yeah that is very correlated! Doesn’t that contradict the original article… because over time, you should be changing as a rider right? and a part of changing as a rider, is that either your LTP should drift further from your TP or it should get closer to your TP…
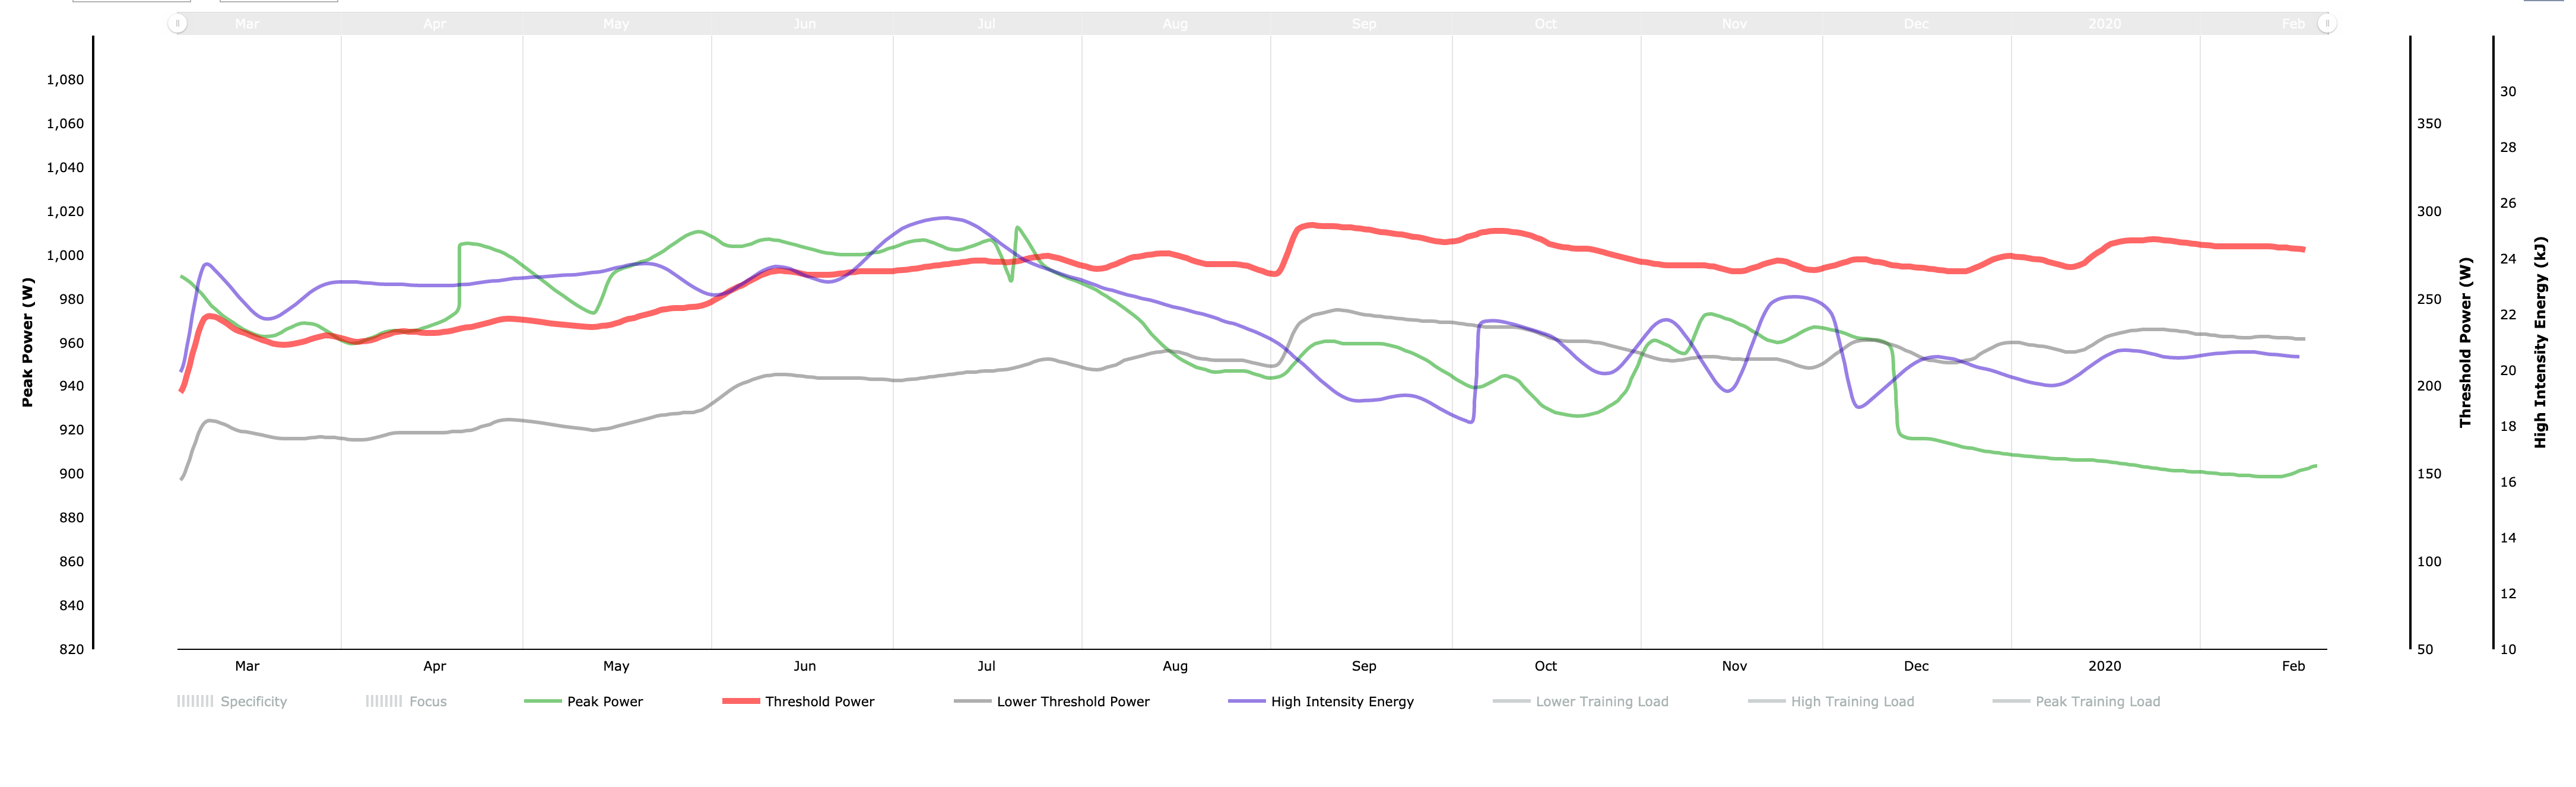
If you don’t mind, can you show the rest of your fitness sig progression? PP and HIE?
Sure… About changing over time: I’m almost 60, so any change would be a decline I had a hernia between dec 2018 and feb 2019, so I basically started all over. Currently, I’m recovering from a vitrectomy and lens replacement…
Apparently, I spent 25% of my rides in my sweet spot zone and I do ride some 15000 km a year, if I’m not injured and have a normal season…
Edit: and I hardly ever do any sprints, not indoors anyway, so my PP looks like shit - that may also have a bad influence somewhere, but my ‘normal’ PP would be around 1150-ish…
No problem. And I agree it should be a selectable column in the activity table. I’d send support an email - can’t be that hard to implement… Ask them to make the list alphabetical too while they’re at it
 I had a hernia between dec 2018 and feb 2019, so I basically started all over. Currently, I’m recovering from a vitrectomy and lens replacement…