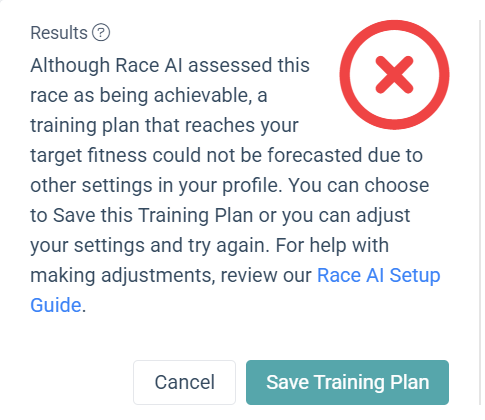
how can I find which setting is the blocking factor? availiability, recovery needs, weight,…
Do you see anything unusual about the General tab entries on your Profile Settings page?
Just guessing but maybe you need to save a selection under the new Activity Time Method option.
Hi @Blouies - can you share the Forecast Chart of your program? What are your current Training Loads? And what are the final/target Training loads for your Event/Goal/Race? Have you adjusted your availability settings?
that’s not it - i have the problem since serval months, but thanks for suggesting, appreciated!
it’s quite a stretched plan, so yes i’m sure i’m rubbing its limits somewhere, and that’s what I’m trying to find out as i understand the message as: your plan is very strechted, and due to setting xyz (nr hours willing to train in a week?avaibility?..) you may not make it
once I know where it sees a limit i can beter judge wether I agree and adjust downward. “Due to other settings in your profile” kind of confuses me, it is recovery needs setting, xss rate, polarity % setting?..
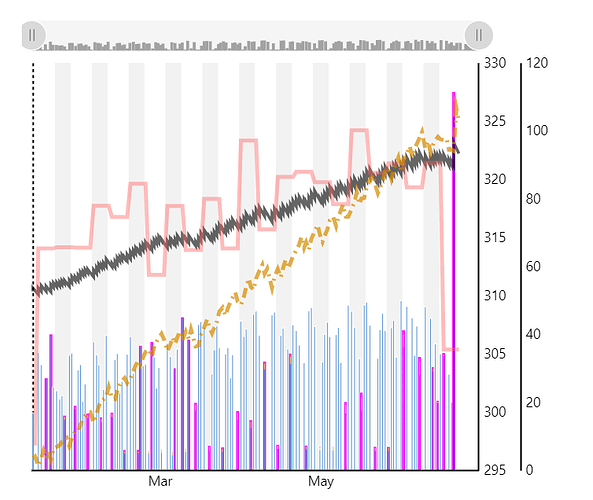
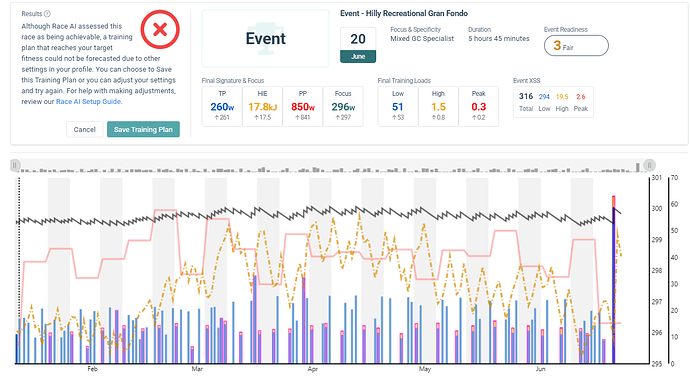
Your constraints (magentas) are the likely culprit – availability vs. max hours.
Do you get the same warning if you use the Focus Type and Specificity from Race AI (ex. Mixed Rouleur) to create a forecast using the Event option?
Or try setting a Goal to improve that Focus Power by the target date.
You could also try running the forecast without any limits on weekly hours or daily schedule.
Then set max hours and recast again to see what happens. Then limit availability and recast.
tx, i played around a bit with the event duration / availability / readiness nr and i agree with you, it’s somewhere in that balance. But in that case xert is way to conservative for me, even achieving a 1h event at today’s fitness (with a top notch readiness) in june was only amber.
the below event xss has less demands, than several rides I do each year, at a readiness of only 3, and yet it gives a red warning, you can see from the graph it’s a horizontal training,so I don’t agree there. As I can “override” the warning, I’ll continue to do that.
where I am going for is the below - I know this is too much of a stretch, but also Xert deems it achieveable, so as a stretch goal I’m good with this, landing just below will be “achieved” in my book ![]()
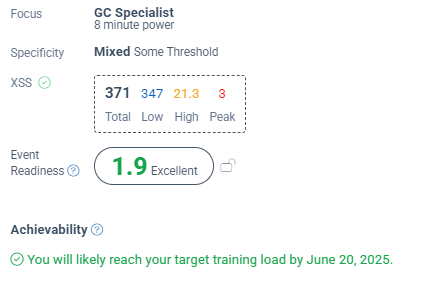

once i run the forecast AI i then get that warning, but I can’t really make up why it seems to say: you’re close to your target (hence the green achieveability) but your setting xyz is preventing you from executing the plan.
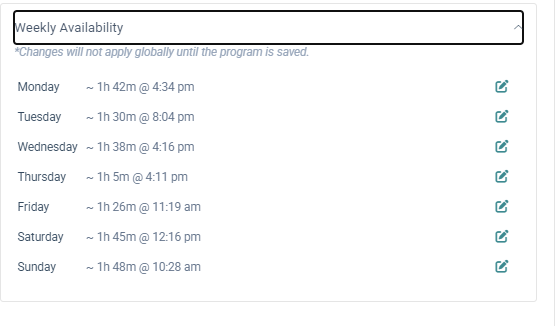
what I thought was the culprit,was that, originally i had set some availability restrictions for training (so not the nr of hours, but the times of days where I could train). Then I had removed them, so xert replaced these with advisor numbers, perhaps xert is now not interpreting these advisor times as hard limits: Monday ~ 1h 42m @ 4:34 pm, whereas I meant: monday I should be able to train as needed, no restrictions, not:on monday I "only have 1.42m available to train).
You can tap or hover over each of the magenta days and the reason for the warning is shown at the bottom of the pop-up box. Sometimes it’s a minor issue you might choose to ignore.
Example:
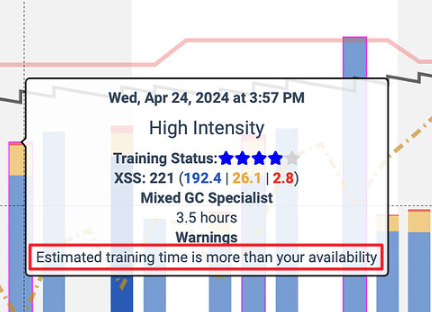
That was the golden tip - from that info i concluded to reduce my recovery needs and now that plan is accepted fully. Thx!
Ideally you want a discernible progression in TL over the term of the plan, but even a flat or minor rise can include substantial increases in high and peak strain to raise performance.
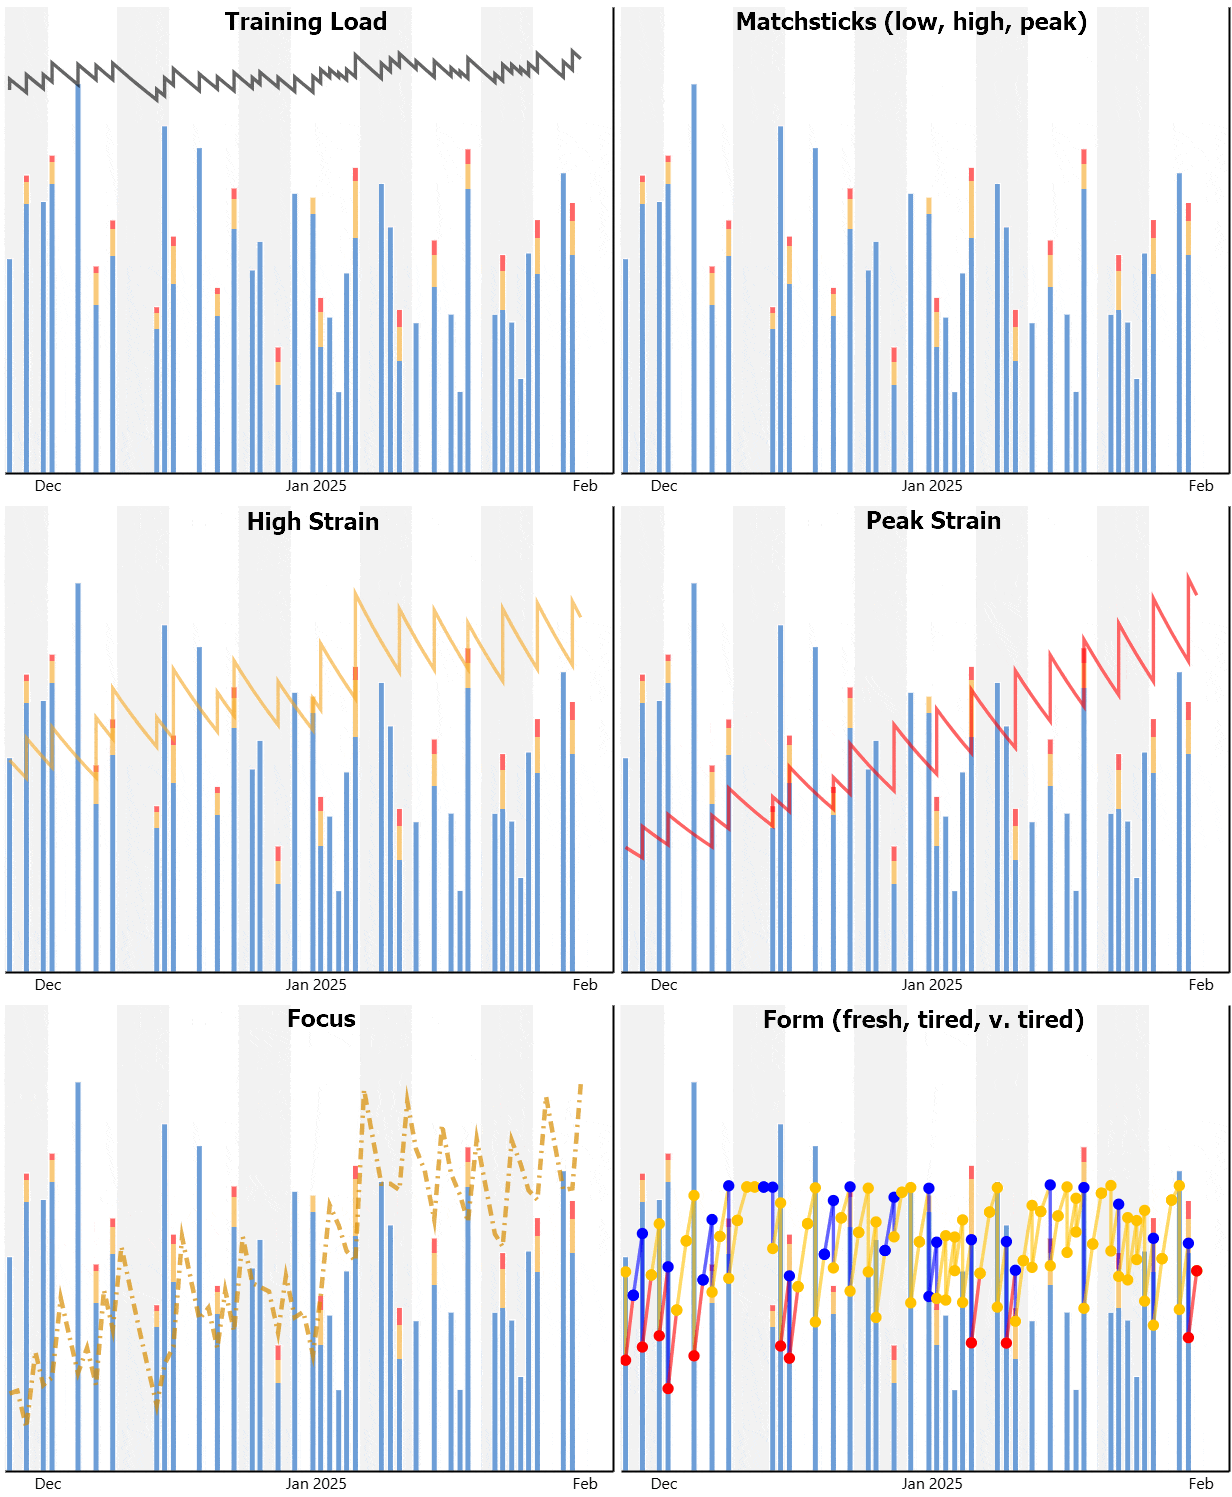
In your example the deltas in Signature and TL are minor other than doubling of high strain but that along with variable ramp rate (weekly hours) and Focus Power changes do make a difference. You can see this best by isolating the chart components one at a time. For example, this gif I made demonstrates what changes occur during a 60-day Goal plan to increase 4-minute Focus Power (Puncheur).
I think Xert will need to tweak how Acheivablity and Event Readiness work and make it more obvious you can run a forecast with “issues” before you decide if the plan is viable or not.
Tx! Yes, by accident i discovered/realised only last week that the “high” training load isnt a flat line, but due to the shared scale with low TL it is squeezed to a flat line whereas it can actually be quite an increase, so viewing low and high TL should be done separate (which the graph allows to (de)select.
