Hi everyone… I can chime in here!
Xert never uses % of XYZ min power to determine Threshold Power. As you’ve pointed out, the actual % will likely be slightly different for each user, so it doesn’t work to assign all athlete’s TP at 95% of 20 min power or 90% of 8 min power, etc. like many other platforms do.
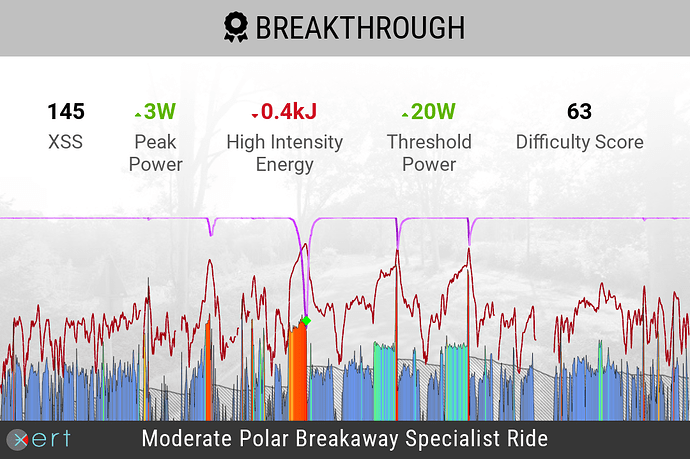
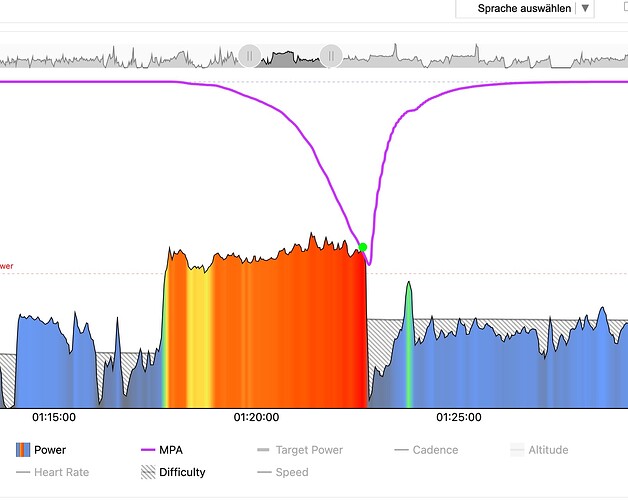
Threshold Power (and Peak Power & MPA) are determined from the interaction of your Maximum Power Available and Power data, especially when you’re right on the limit of fatigue. As Wes mentioned, if the effort is just abruptly stopped, then there are many combinations of PP/HIE/TP that could match that one singular effort to failure, just as it’s possible for many different athletes to have the same/similar 20 min power despite having different signatures (more on that below).
Xert doesn’t think this way, but another way to think about this is that this 5 min effort (~377 W) was nearly 50% (actually 46.7%) of your 1s peak power. Also, at the end of the effort, your MPA could have only gone down to ~380 W, because that was your power at the end of the effort. Since your HIE is only ~14.0 kJ, that indicates that most of that work had to be done by your aerobic system, hence the large bump up in Threshold Power as a result of this activity.
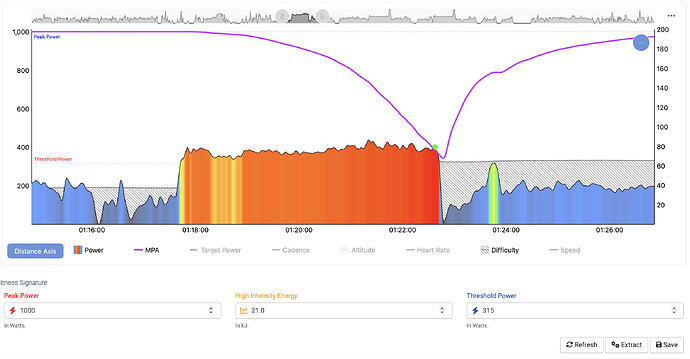
On the other hand… if your Peak Power is higher, than HIE is also likely much higher, since those usually scale directly with one another. With a higher Peak Power (say ~1000 W) & HIE ( ~20.0 kJ), this effort becomes possible with your existing TP of ~318 W:
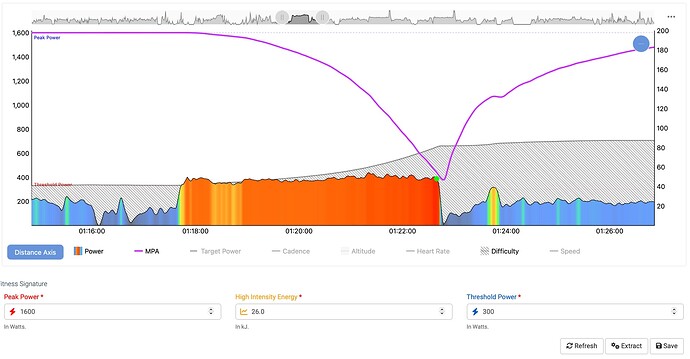
And again, if your Peak Power was much higher, this same effort would be possible for someone with a TP of only ~300 W:
Hopefully that helps explain the importance of Peak Power when calculating your signature, as well as why it’s helpful to Xert to continue efforts until you physically can’t pedal anymore (or standing & sprinting all out at the very end), rather than stopping abruptly.
As we saw above, based only on the ~5 min effort, there are at least 3 different signatures that could explain this performance!
