For those of you nerdy/sciency types, a paper has been published as a pre-print here which covers some of Xert’s methods including XSS, 3 dimenstional impulse response models and how these can be calculated.
Happy to answer any questions.
For those of you nerdy/sciency types, a paper has been published as a pre-print here which covers some of Xert’s methods including XSS, 3 dimenstional impulse response models and how these can be calculated.
Happy to answer any questions.
Hi Armando,
Thanks for sharing. It seems that you guys are using Skiba formulas for W’ (HIE) depletion and replenishment. These formulas have some questionable assumptions, namely:
Any coach or experienced athlete would notice that these assumptions do not reflect real-life experience. How are you improving this for a second version of the model?
Thanks
Great question, Lucho.
Firstly, the content of the research isn’t exactly what is implemented in Xert. We have made a number of improvements but the foundational principles are the same as what is in the paper.
The Skiba W’bal depletion/replenishment model, which is built on the CP/W’ model, does have a number of limitations, as you point out. However, the most significant limitation is in how CP and W’ are determined and used, with the biggest limitation being that W’ can be fully depleted, i.e. W’bal reaches 0 at exhaustion.
In Xert, we made a change to this and say that W’bal doesn’t reach 0 at exhaustion because MPA gets in the way meaning that you can’t fully deplete W’ at say 500W because at some point in an exhaustive 500W effort, MPA will reach or go below 500W and you can no longer sustain 500W (becomes a maximal effort or point-of-failure). If you model that with W’bal reaching 0 at this point, then the next data point where power is > CP but less than 500W, will cause W’bal to go negative, making the method invalid. Everyone that’s ever used Xert and has understood it, knows that when you do a max effort / reach point-of-failure, power doesn’t always just drop off. Sometimes you can hold power above TP, even close to MPA, for extended periods. CP/W’/W’bal cannot model this.
When you solve this limitation, the model actually becomes far simpler and much of the science that is studying changes in W’ or changes in replenishment rates are no longer necessary. They are chasing artifacts due to a flawed original model.
Referencing the explanation of the Banister model, does Xert use k factors applied to training load and recovery loads in order to model performance? My impression is that ‘performance’ or fitness signature is purely based on TL?
Could Xert evaluate a BT with form of -10 differently from one when form is +10? It’s not purely a theoretical question as often an athlete won’t want to ‘freshen up’ to get a ‘good BT’ (lost training time), so if Xert could figure out that a max effort when fatigued (negative form) is a BT even if it’s below my ‘fresh’ signature, it could be even more useful? Probably raises the point of what freshness the signature represents in the first place… I’ve seen references to ‘when fresh’ but nit sure what it means in this context
You are correct that at the moment, only the training loads are used in the prediction of your signature. We did originally attempt to factor in recovery load but didn’t see a significant enough improvement on the fitness prediction from using TL alone. This is likely partially do to the fact that even with some fatigue, you can still express your signature.
Since that original analysis, we have made improvements to how RL is calculated. We announced these changes about 1.5 years ago when we rolled out Forecast AI beta. We needed to improve how RL is calculated in order to allow Forecast AI to work properly after many days of inactivity. Very high form values simply didn’t make sense and would cause XFAI to schedule successive days with too much training. With our changes to the impulse-response model, we feel we’re now in a better position to see if RL’s k coefficient should be non-zero to improve predictions.
This being said, there is also the move to Xert 2.0 that we are in the midst of working on and planning. This will change our signature parameters (TP, HIE and PP will become derived parameters that are calculated from more fundamental, less covariant, underlying parameters) and so we’ll need new fitness models. We’d like to use computational capacity and more sophisticated learning methods to improve our ability to model individual training load time constants, training responsiveness and the impact of day-to-day fatigue at the individual level. We have some really cool ways to do this that we are excited about.
Can you say more?
Hey Lucho,
Sorry for the delay.
HIE * 1000/(PP-TP) is generally between 22 and 30 and often pretty close to 26. So if PP goes up, HIE goes up too. Also, we see HIE really taking part in producing power below TP so the formula is probably more closer to HIE * 1000/(PP-LTP) or better still HIE*1000/(PP-LT1) which decreases this “26 value”. PP can therefore be calculated as LT1 + some number X. So if the “26 value”, LT1 and X are the new signature values, we just need a way to derive TP. ![]() This is somewhat computationally challenging since TP should be a function of power and HIE is both consumed and replenished concurrently since it gets consumed above the computed TP but replenished below a new “maximum threshold” number. At the power where depletion and replenishment are equal, we have a point of equilibrium that could be considered steady-state. This ends up being below upper limit of aerobic capacity. This can be computed as well.
This is somewhat computationally challenging since TP should be a function of power and HIE is both consumed and replenished concurrently since it gets consumed above the computed TP but replenished below a new “maximum threshold” number. At the power where depletion and replenishment are equal, we have a point of equilibrium that could be considered steady-state. This ends up being below upper limit of aerobic capacity. This can be computed as well.
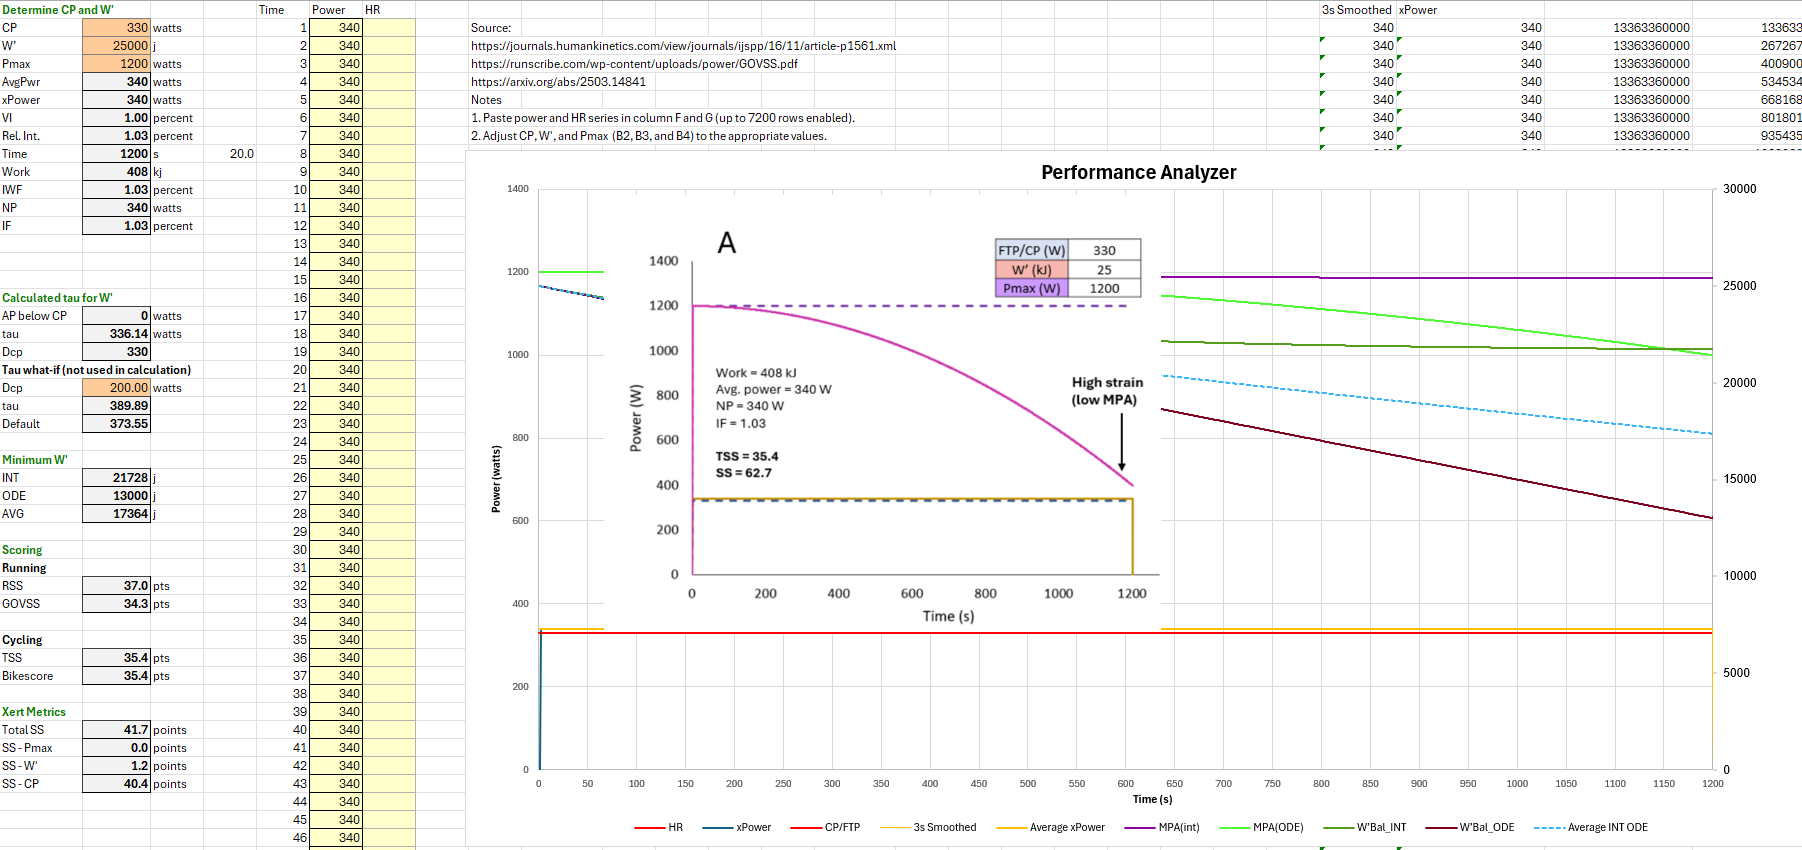
Thanks for sharing the paper! It’s a very cool model. I coded your equations in Excel and my implementation produces the correct values found in Table 1. But I have a couple of questions.
I’m not able to reproduce Figure 4A. Maybe I am calculating something incorrectly? How does W’ (MPA) draw down so quickly?
Can you share the actual workouts that correspond with Figure 5 (A-D) and the CP, W’, Pmax? I can only match two of the scenarios with your values, so I’d like to double check my sheet.
Hi there, thanks for your interest in the paper. Doing the quick math now I think you’re right. There must be a mistake: 10 W above CP consumes 10 J/s = 12 000 J in 20 minutes. In the figure 24 000 J has been consumed at the end. So it’s double. Checking my spreadsheet, the same error affects the workouts in Figure 5, which explains why you couldn’t reproduce the numbers.
We are working on an update to the first version of the preprint and will add this to the list of things to fix - thanks for catching it!
H
Thank you for confirming! I look forward to the next print.