Progression of TL seems off.
Looking at a 2 week period to allow a clear explanation
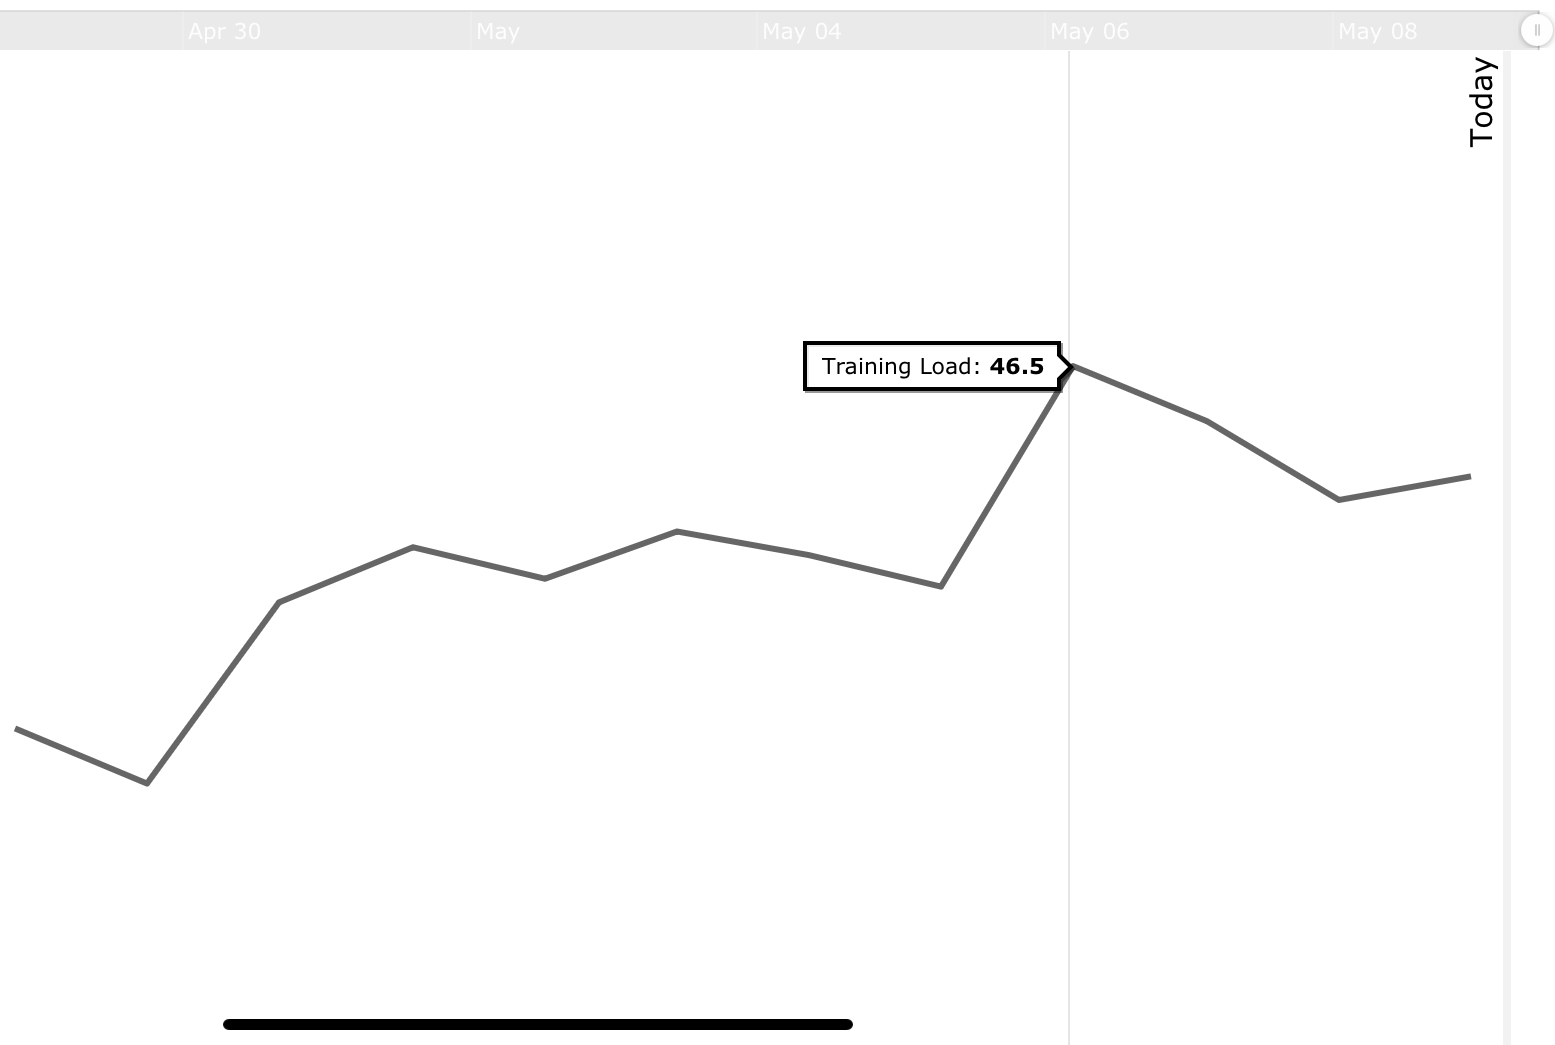
TL goes from 46.5 on Monday to 47.2 on Wednesday to 47.6 on Thursday
However the graph shows the Weds and Thursday lower than the Monday
The same if I expand the period to look at year to date.
Not exactly the end of the world but seems a bit odd.