J’ai l’impression que la valeur de ramp rate est anormale quand je regarde l’historique du planning un mois en arrière et plus loin.
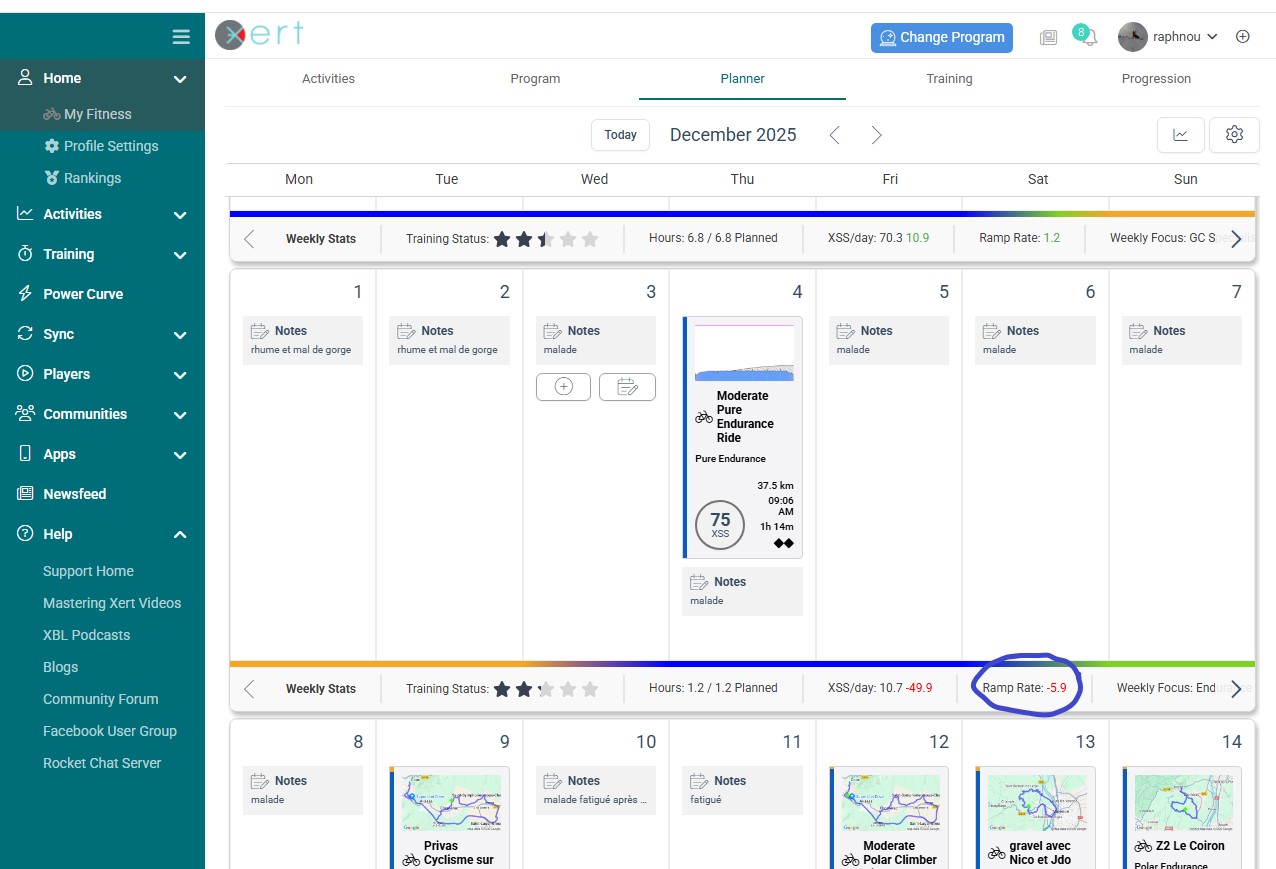
Je suis actuellement aux alentours de 2, j’avais déjà consulté les valeurs d’historique qui me semblaient similaires, mais aujourd’hui je vois des ramp rate de 5 à 7 sur certaines semaines, et sur cette semaine où je n’ai pas fait de vélo car malade, le ramp rate est à 6
The Ramp Rate number is a relative value in line with XSS/day.
The value shown on the Planner is the number at start-of-week (end of prior week).
To see this in action toggle Chart View in upper right of the Planner.
Next disable everything in the legend except XSS/day and Ramp Rate.
Now hover over the dots on chart and note the starting values for each week.
The number on the Planner will match the value shown in the table.
That value corresponds to the dot on the chart which is truncated to a whole number.
E.g. 2.4 in the table would display as 2 on the chart, -.8 would display as 0, -6.7 as -6, etc.
Merci RidgeRider2 pour ces précieuses explications
En fait, je voulais savoir si c’était normal que Xert me donnait un ramp rate de 6 pour une semaine où il y a qu’une seule activité? Mais visiblement c’était un bug car maintenant le ramp rate de cette semaine du 01/12 au 07/12 est passé à -5.9