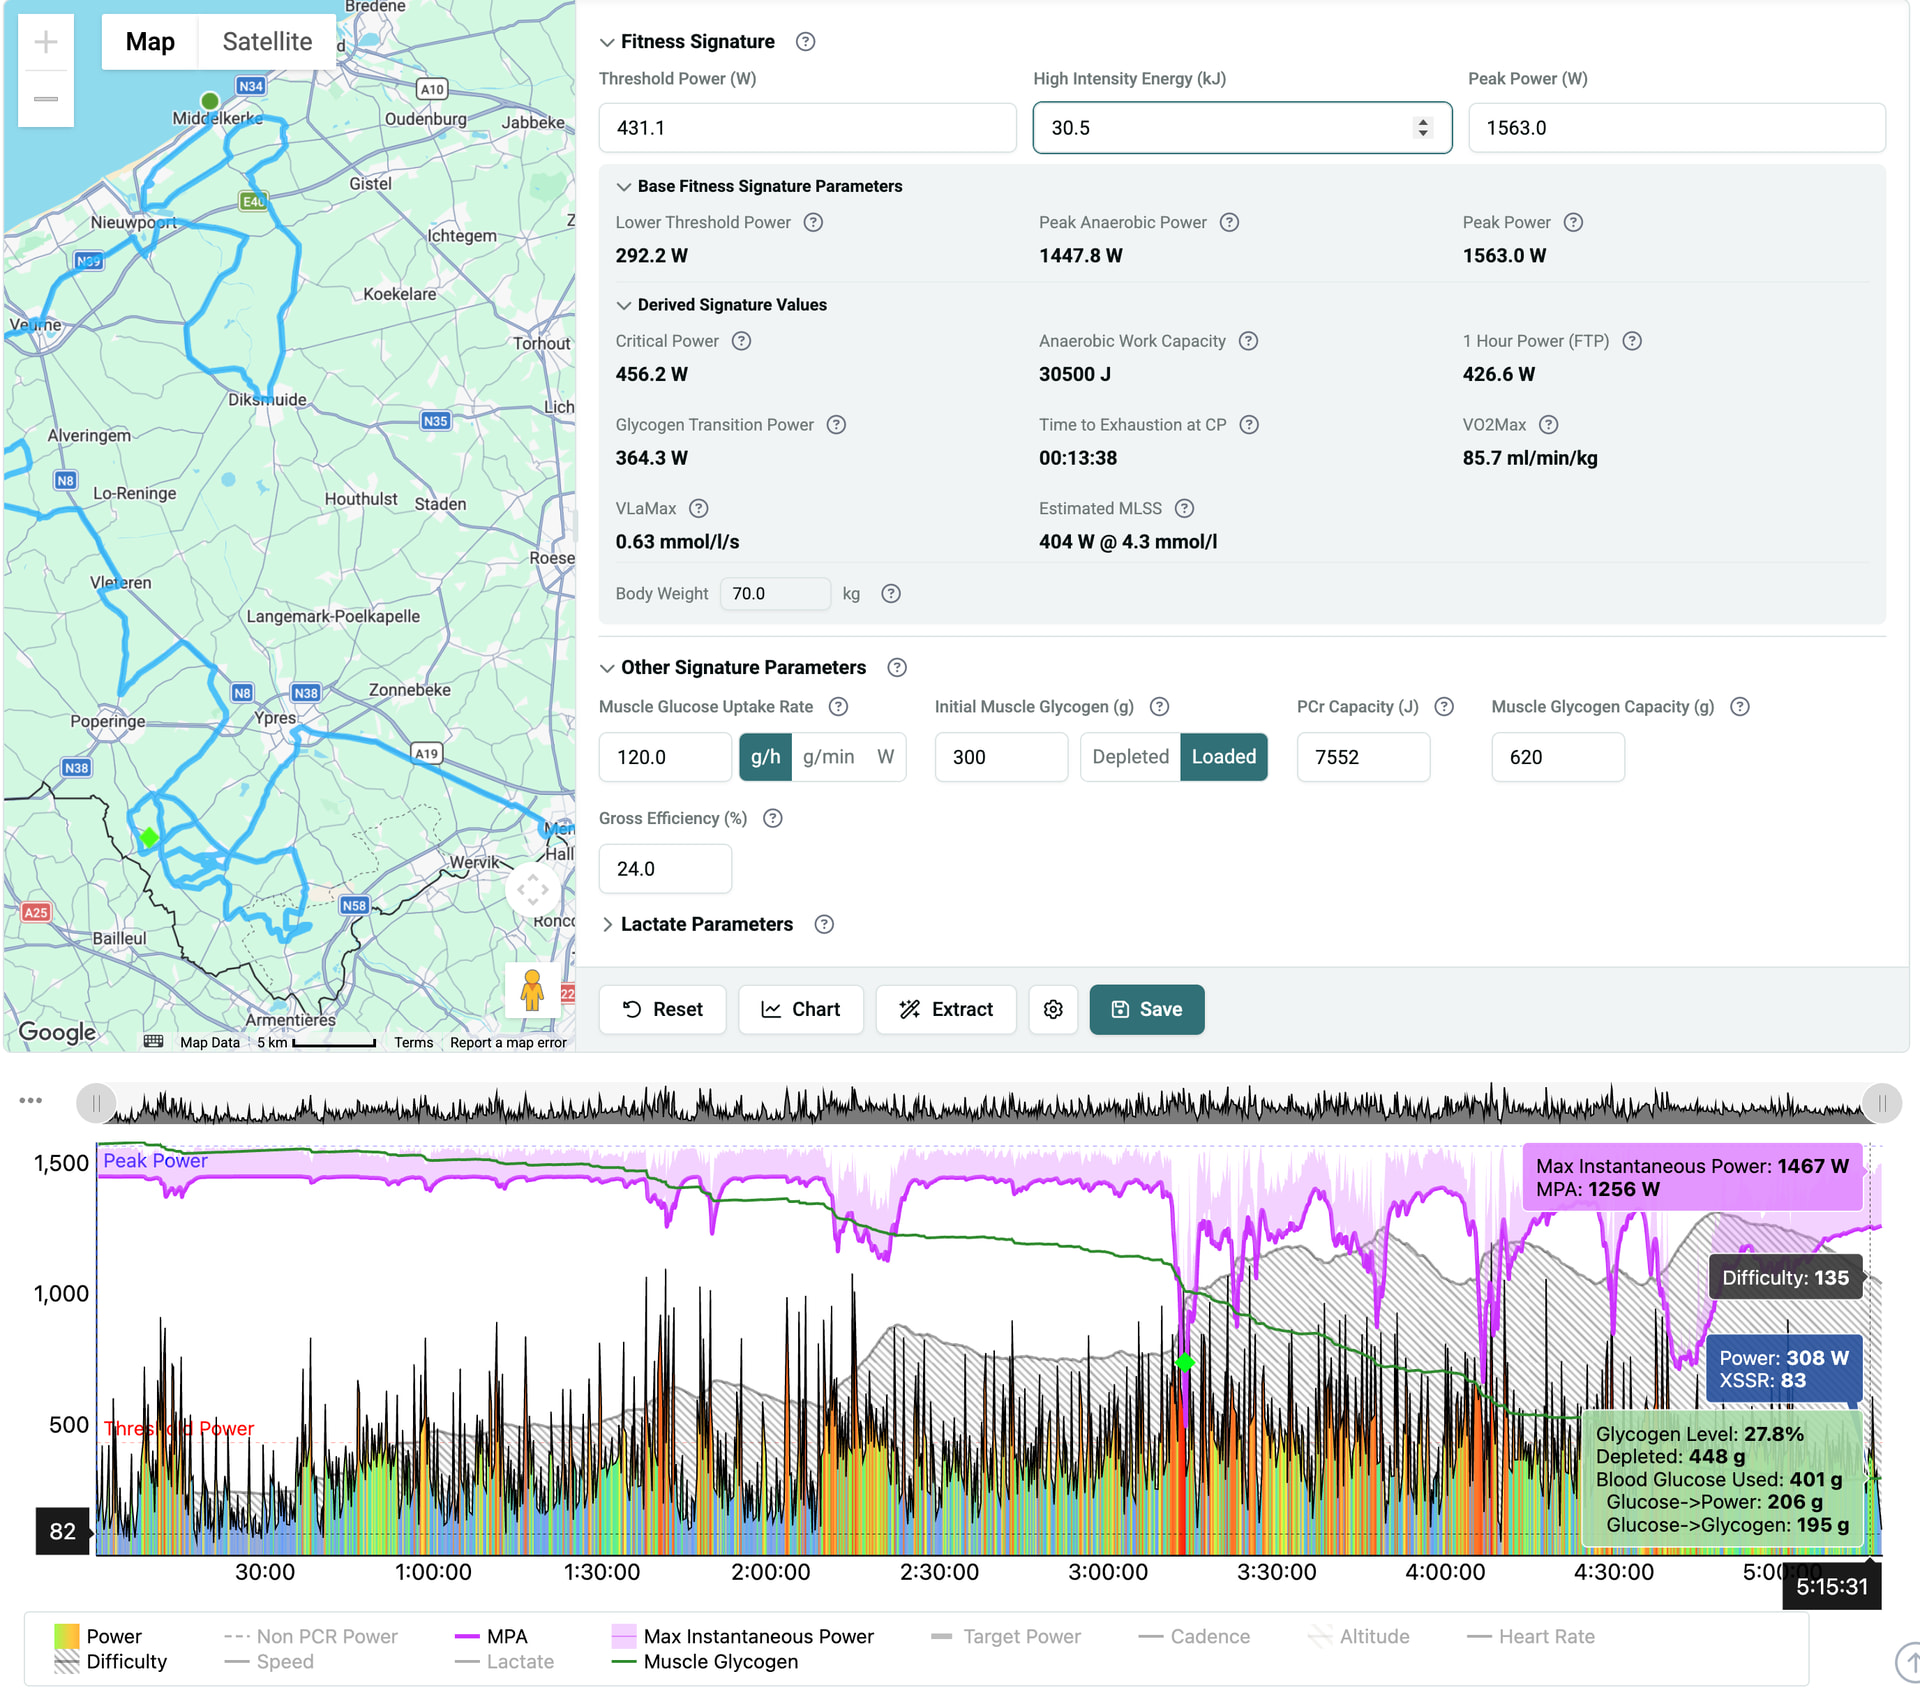
We created a “What’s My FTP?” online calculator that will estimate FTP, and a number of other physiological metrics, based on a single FIT file. For Xert users, the tool is based on our Xert 2.0 Metabolic Model for Exercise and makes a number of assumptions (similar to the 95% rule) and shows some new metrics that will be part of that. Xert 2.0 will be made available as beta when ready (don’t ask when, please).
Do share with those that aren’t familiar with Xert or use it with them to explain some of the new concepts. Feel free to share links where users can benefit.
Interesting, but significantly different result from my last race.
I did a breakthrough on a event last sunday. Got dropped at a climb after an hour of on-off in a big group. BT gave me: 323 TP (+15), 25 HiE, 1150 PP, 260 LTP.
Uploaded the same file into the tool and that gave me: 303 FTP, 313 CP, 30.4 HiE, 1254 PP, 226 LTP, 31:25 min TTE.
I do think the latter is closer to where I am. 313 W for 30 min and 300W for an hour seems achievable if I really wanted to, I did peak at around 1250W this winter when I was significantly fresher and I recently did an 3h-non-stop-ride at 230W average.
edit: after manually typing 313 for TP and clicking “extract” in the activity it changed to 1282 PP, 29.1 HIE, 315 TP. Did you change that too? Slightly different results whenever I click “extract”, but nothing relevant.
Cool and have already shared with some non -Xert users
One question - we see different estimates of FTP, MLSS, CP… aren’t they all meant to be estimating the same thing? That’s what I recall from Coggan at least… maybe CP is biased a bit high because it’s estimated from shorter efforts though
The contribution from aerobic, anaerobic and alactic sources is continuous and context (read “fatigue”) dependant at all intensities and between LT1 and LT2 is particularly sensitive. So while the values are all fairly close, they are calculated with modeling assumptions (CP/W’ most notably) or in case of FTP, it’s more commonly seen as a performance metric (1-hour power despite all of Coggan’s attempts to claim otherwise). And while 1-hour power is close to starting threshold, your true threshold varies over the course of the hour. It’s not fixed. If it was, you could keep going for another hour, and another, etc. We’re modeling how the metabolic state changes over time and deduce FTP as 1 hour sustainable power. Check the resulting PD curve how sustainable power decreases as duration increases.
You can tweak the settings in the tool to see how they change FTP and the power curve.
More will come out on the 2.0 model in time. It will bring an entirely new and comprehensive picture of energy metabolism during exercise.
Xert 2.0 is a complete metabolic model that ties power to metabolic processes - oxidative, anaerobic, alactic. As an example, we’ll be calculating carb usage (both glycogen and blood glucose) directly as anaerobic work. Durability will have several variables that you’ll be able to review and manage. Here’s a screenshot of the Activity Details 2.0 page:
You know the more you share the more questions you will get
Not related to the screenshot as I’m sure that will be explained in good time, however any hints whether training prescription will change as a result? E.g. different targets for endurance… or differentiation between sub threshold vs tempo vs endurance in the plan / periodisation?
I notice the other signature parameters on your activity data field you kindly shared. Are you going to be incorporating data from breathing rate, like you get from Tymewear for example?
I think an MCP tool from us combined with one from Tymewear would allow you to ask an AI tool to compare breathing rate with MPA, for example. Similar idea with other data sources like a Core temperature sensor, blood glucose monitors, wearable EKG, HRV or other types of training like gym workouts or nutrition monitoring tools (e.g. Hexis @Mike_D). So many new products and new tech that could be used with Xert.
Let us continue to focus on Xert 2.0 modeling since that’s where we can deliver the most value to you and other athletes and let the wave of capabilities with AI drive all the integration, aggregation and data visualization. It’ll do that really well.
As an aside, there are SO many new endurance training platforms popping up doing some portion of this integration and aggregation. They will be short-lived, mostly because the endurance training market isn’t a massive, booming market with Zwift and Garmin already taking up most of the oxygen. Unless you have something truly unique to offer that isn’t easy to replicate, you won’t survive. AI will simply replace you. ** Note to all those asking for access to our API with the next-best endurance training platform.
That sounds awesome @xertedbrain . One question though, will it be able to account for the gross efficiency of different riders? GE’s between 19% & 25% result in significantly different calorific expenditure for riders putting ou the same power numbers. I’d completely understand if it didn’t automatically but a setting to manually alter the your GE from the average should be possible I would have thought.


 BT gave me: 323 TP (+15), 25 HiE, 1150 PP, 260 LTP.