I like the new monthly chart feature. But it could use I bit of finishing polish.
Let’s say I want to quickly check my current form, today is the 25th of May.
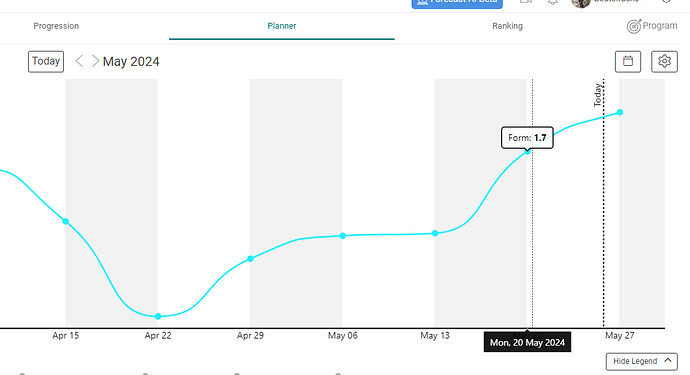
If I go over it with the mouse I can either make it tell my form on the 20th of May:
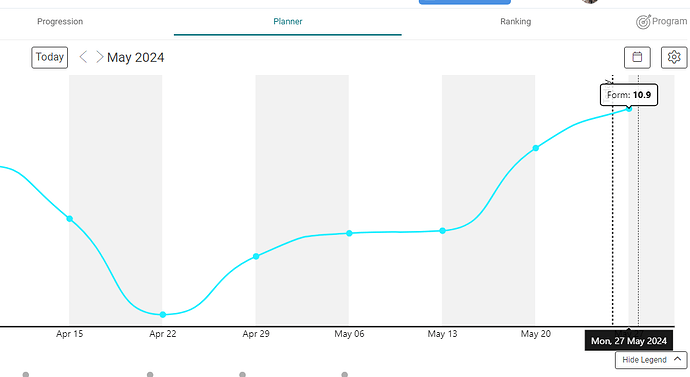
…or slightly moving right it shows me my (projected) for on the 27th of May:
So there is the vertical marker of “today”, but no way to make it show the value for today. And as the graph is missing a Y-axis scale, I also can’t read it from there.
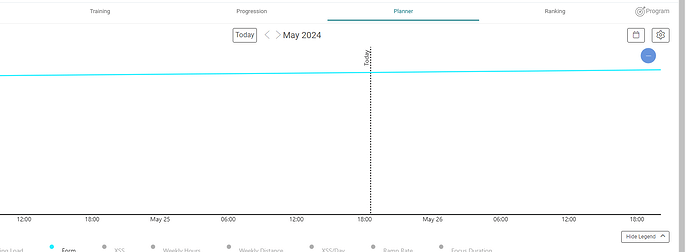
But hey, I can zoom in!
…but then it doesn’t show any value any more.
That’s probably easy to improve.


