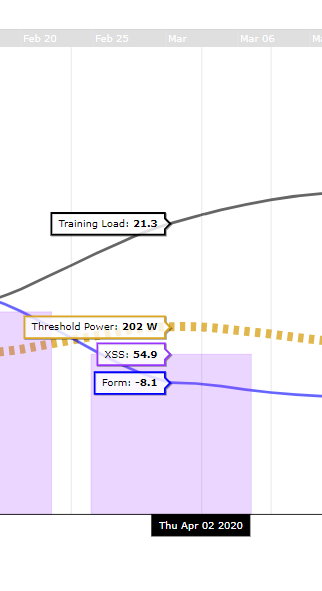
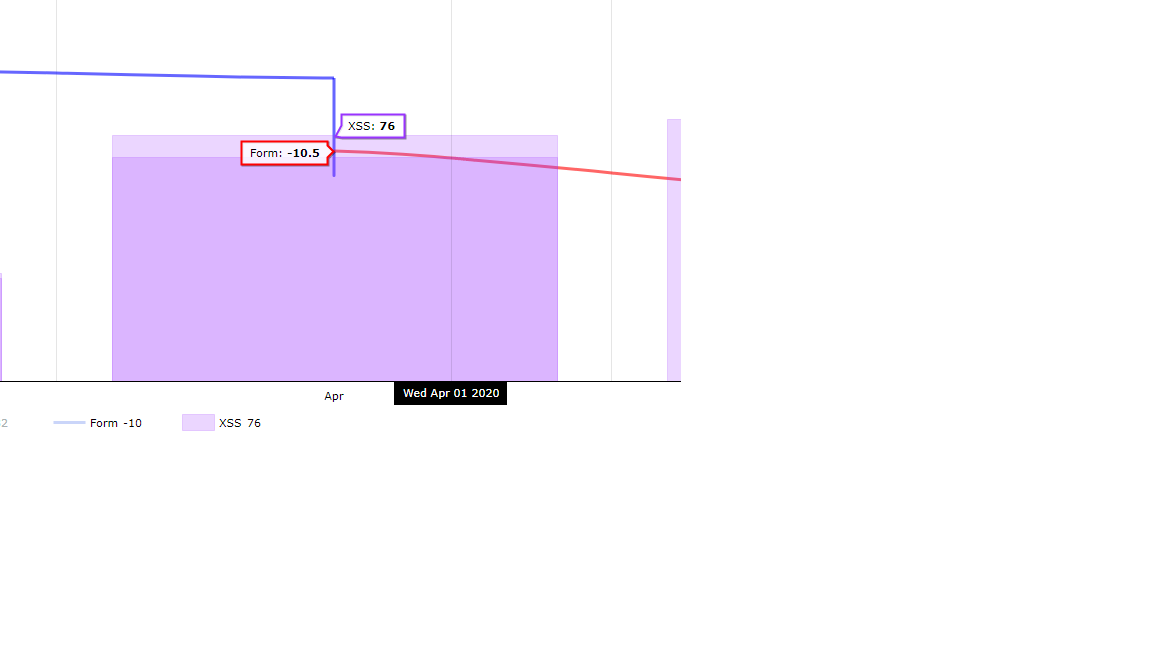
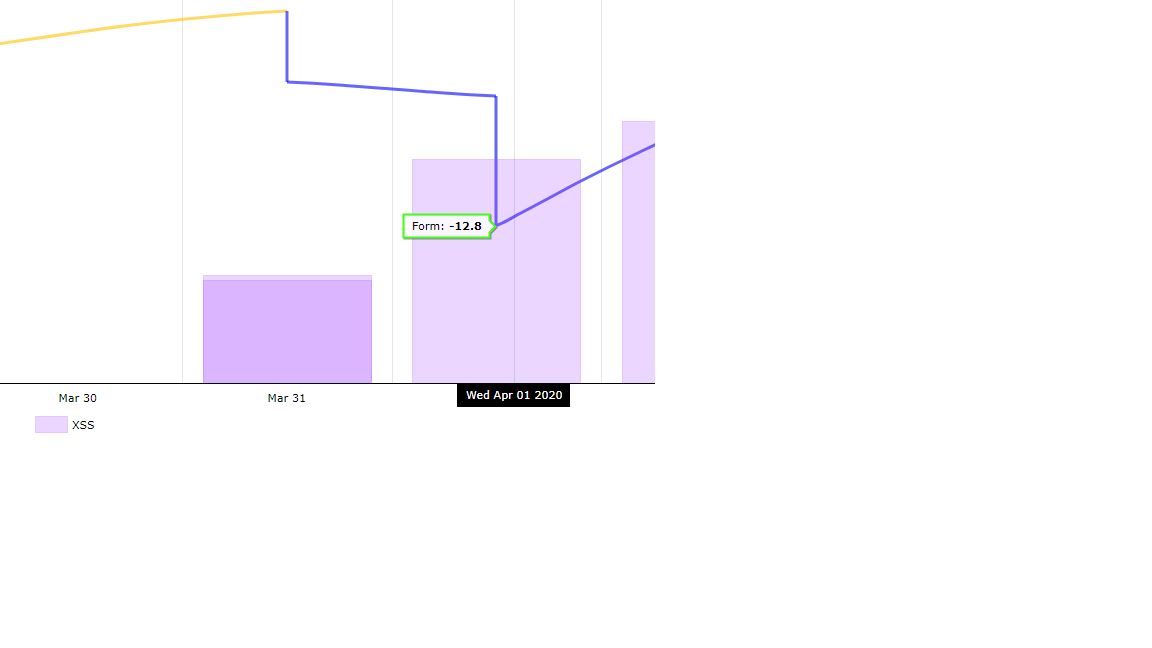
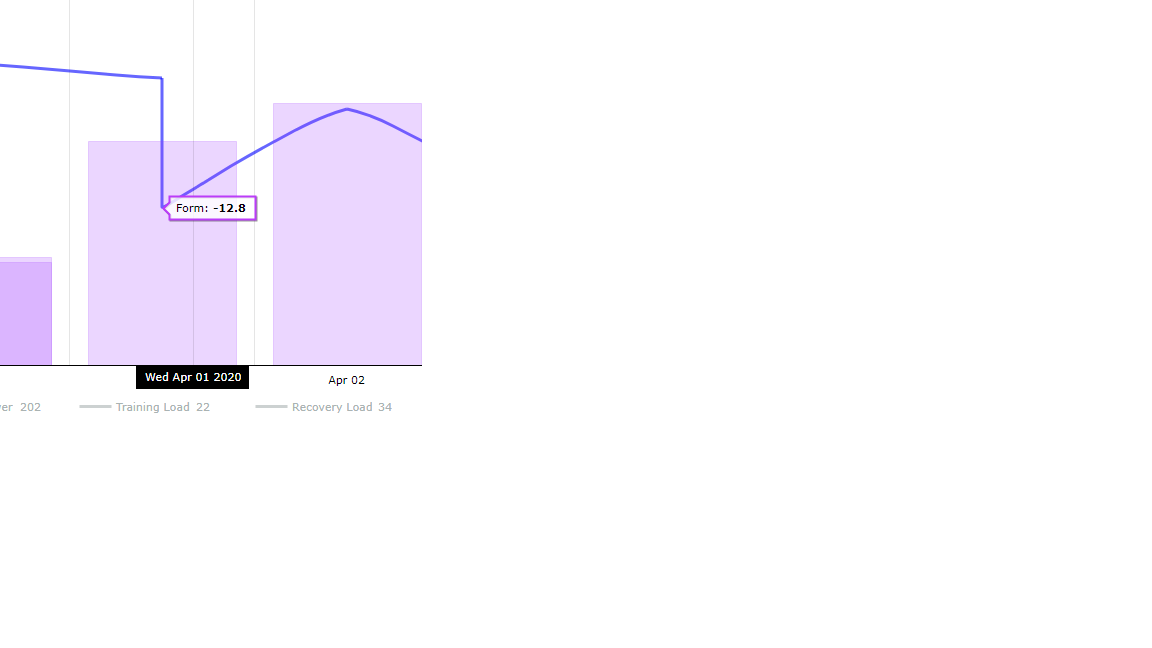
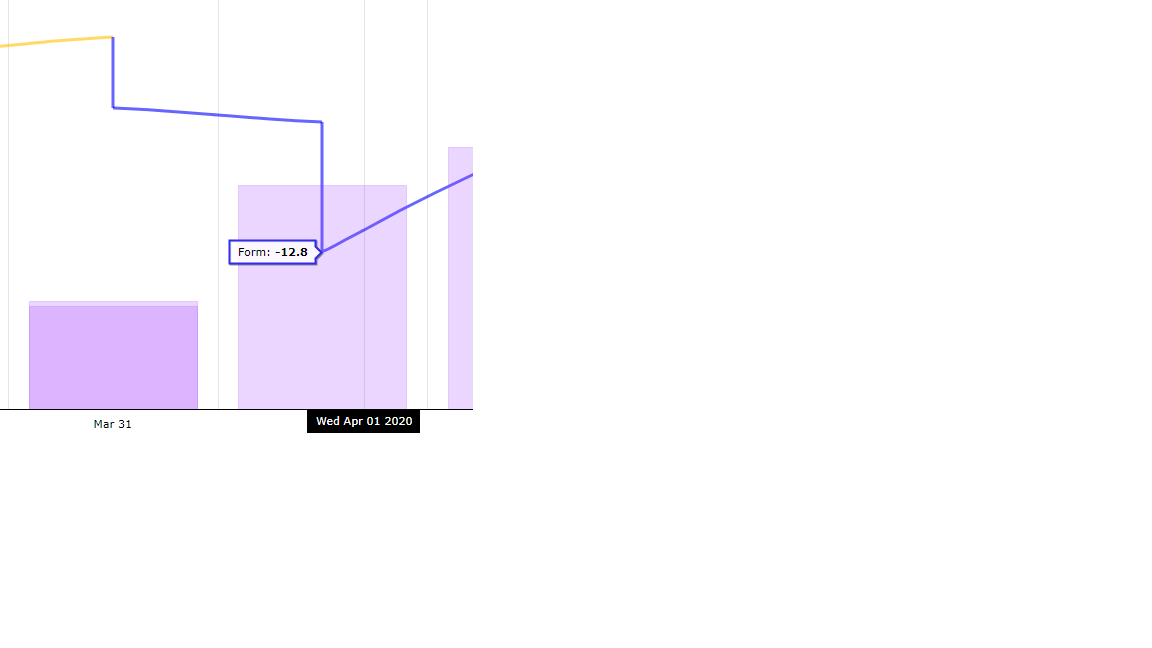
I noticed, that when having 70+76XSS workouts today (first pic, one is scheduled, but its should not matter) I get better form -10.5, than when having only one 70XSS workout for this day -12,8. I closed browser, cleared cache, waited 30 minutes, but its same. And funny thing is, that every time I refresh page, form gets different color and get even color, that are even out of freshness form color spectrum (violet)
The charts are meant to show the Form at the onset of each activity (completed & planned) as well as the current form. Without having the exact details of what was planned & when in front of me, I can only speculate here… but it’s possible that you had different start times for the planned activities that you were trying to compare, which resulted in the minor difference in form. Unfortunately, the charting system we use doesn’t have great temporal resolution when you’re looking at a single day because the XSS is applied discreetly (as I mentioned above, all training & recovery loads are added at the start of an activity). This really wouldn’t be resolved until we moved to a system where XSS could be applied continuously, where you wouldn’t see the jagged jumps in TL & form.
yeah I learnt that form I can see on each day is form before starting activity and in order to see how my form will be in a couple of days on chart, I need to schedule workout in that day. What I dont get, how 70+76XSS can make higher form than that just 76XSS, even when they would occur in different time, I cannot see how it could result in a better form. I understand that you would need to see that specific case to investigate and find cause. XPMC shows -2.8 form today, so It seems to be confirmation, that something was stuck on xert side. And its easy to simulate similar situation: I did attempt now- my form now is -14.8 and I scheduled workout hot blooded with 76XSS for 23:58 today and get form -13.1. You can check my planner by yourself. And what about that form color change by every F5 press?
Perhaps something to pass dev team…
You wrote : I mentioned above, all training & recovery loads are added at the start of an activity) I dont know, if we understand each other, but its not how it works: form, TL, RL is added to next workout. I tried to schedule workout with 20 and 200XSS and TL, RL, form are the same in that particular day, i need to schedule another workout in next day to see affect in TL, RL, form of this workout.
Yeah, I’ll try to make it as clear as possible to avoid confusion.
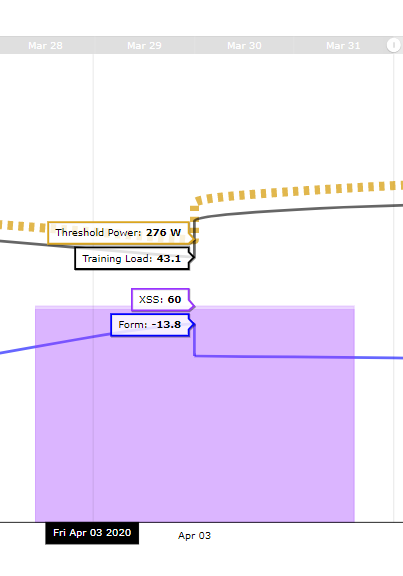
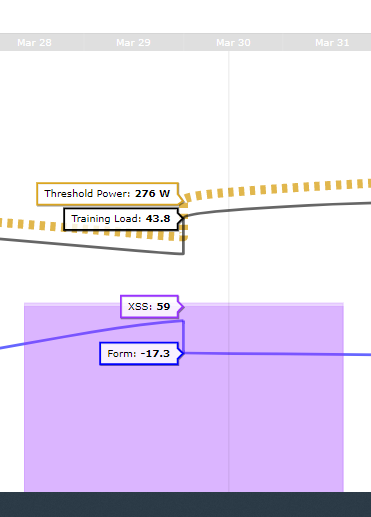
I’ve planned 2 workouts in my planner for tomorrow, 12 hours apart. If I hover my mouse on the left side of the day, it will show me what my TL, Form, and TP are at the start of the first activity. When I hover my mouse on the right side, it now shows the TL, Form and TP at the start of the second activity (note TL is higher, form is lower for the second activity).
If I also schedule a workout for the next day, it will then display my TL, Form, and TP at the start time of that activity (which includes the XSS from both rides of the previous day, plus the recovery that occurs in that 24 hour period. You can see the TL is even higher and form is still slightly more negative).
To be entirely honest, I very rarely look at the actual value for form, as it really tell you anything - I use the color of the form to guide what session I’m going to be doing, and maybe occasionally adjust with the FF slider. I would have to ask about the form color. The charting software should return only colors that are on the spectrum. I double-checked my entire progression history (~3 years) but did not find purple. Might have to do with either borderline cases (borderline red/blue or yellow/blue form) or could also be something with planned activities - hasn’t been a real issue ever.
yeah, its exactly how I found that works, we understand each other in this perfectly. What I have been trying to point at all the time is, that I get lower form with less XSS, showed examples and I asked if it can be explained. By my opinon, xpmc would need some function for recalculation - I experienced this with Todays plan, when adjusting plan, it did not reflect on load chart, they made recalculation function and it works now. But it may not be a case. I agree with you that using xata can be sufficient, but xpmc should work correctly anyway. thank you Scott
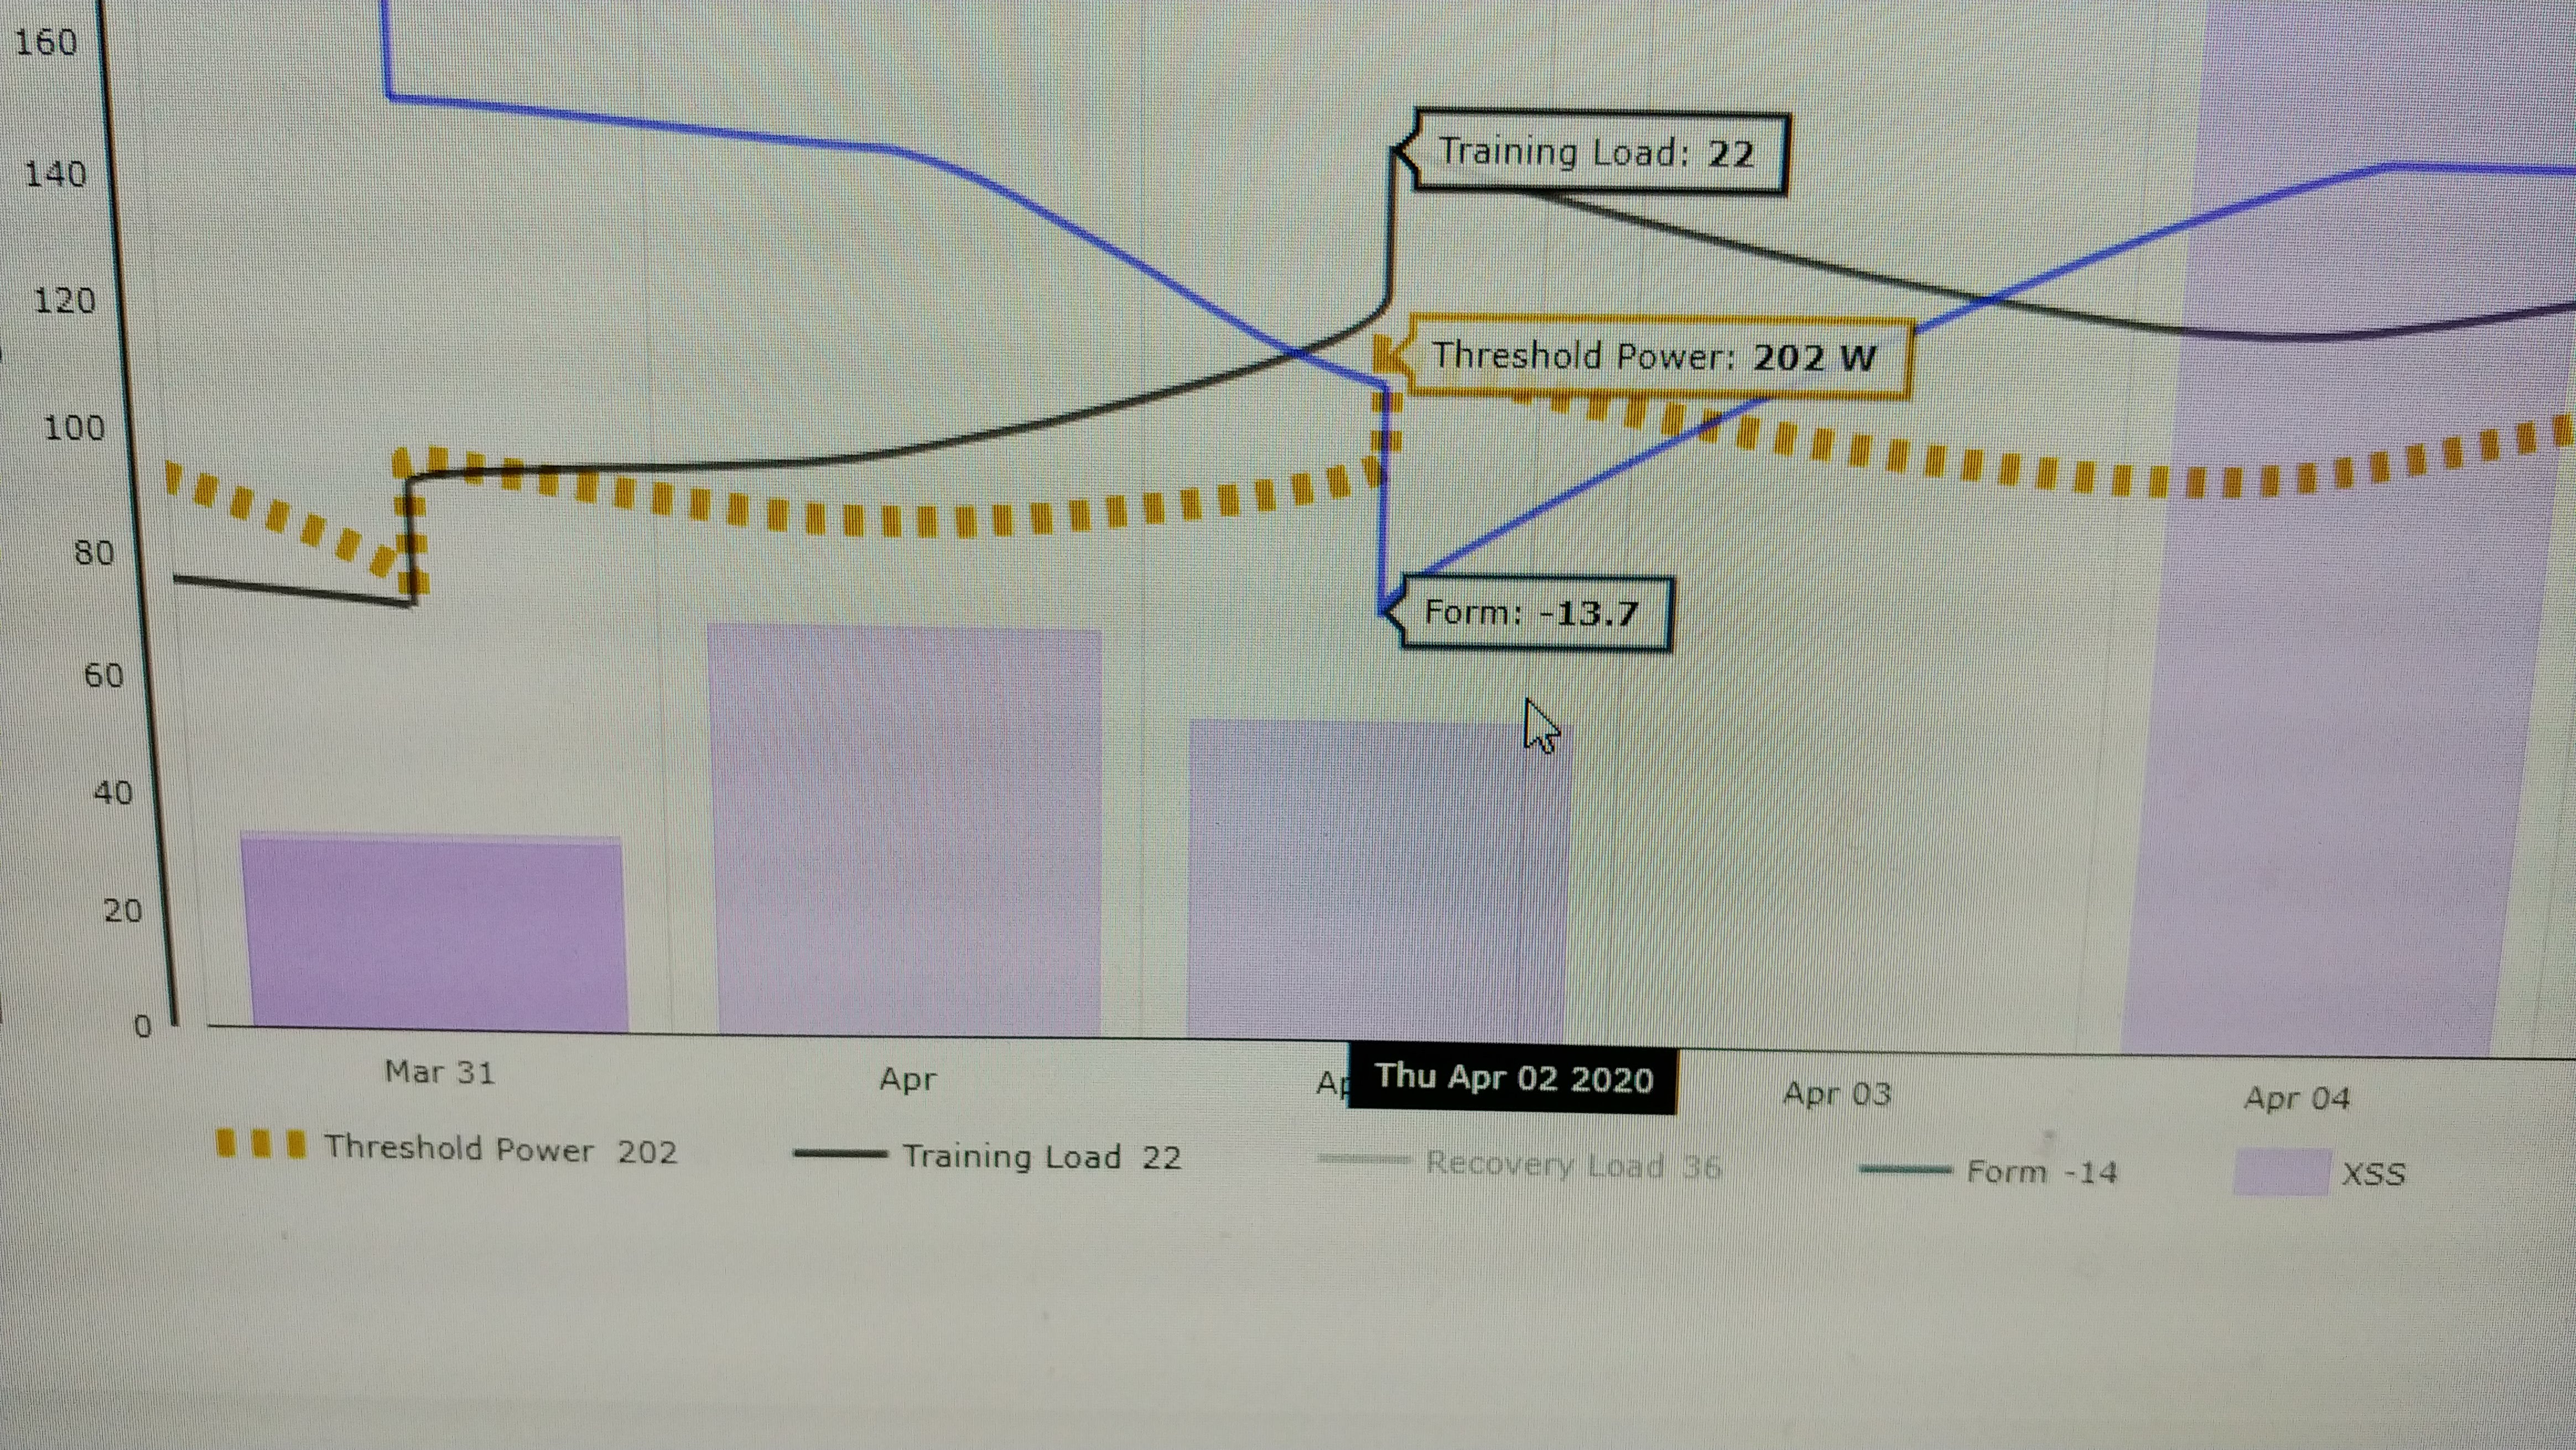
I checked chart in the morning and dont understand what chart does, it showed me form: -13.7 yesterday(its after completing workout including 02/04 XSS, i checked it by scheduling workout in next day)
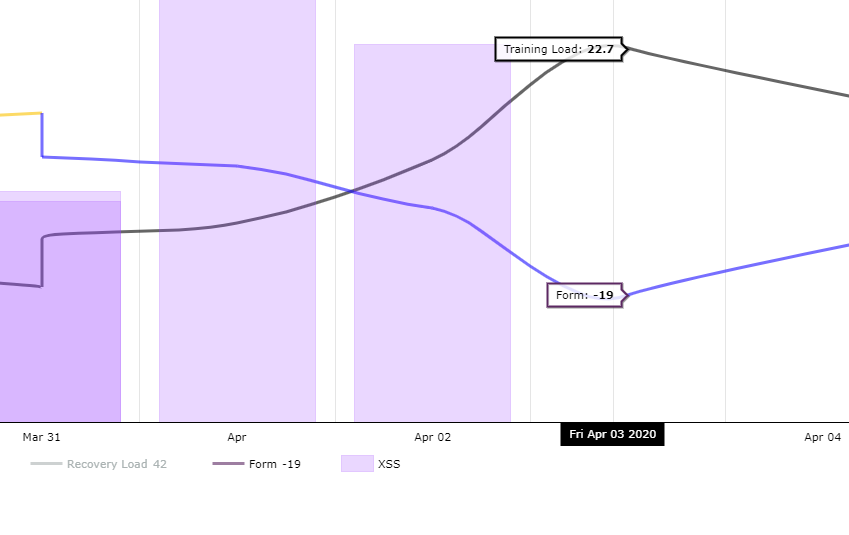
Yup, behaving as normal. Your form when you started yesterday was -13.7. When you include the XSS from that activity (plus the recovery from overnight), your form when you start today is -19.
Scott, I played with chart a lot, got different values through a day, even for future days, when it should not be affected by getting fresh, tried to find logic in it, understand how exactly it works, but I am done with that, this was demanding (for both of us: ) and the best will be to used XATA Advisor and planner. I still will use other part of chart, strain, signature, but will stay away from xpmc(with some exaggerating).
Remember that form is displayed at the start of each activity, as well as your current form. I actually logged in as you to have a look and make sure I understand everything and I think I’ve got a clear answer for you (hopefully)!
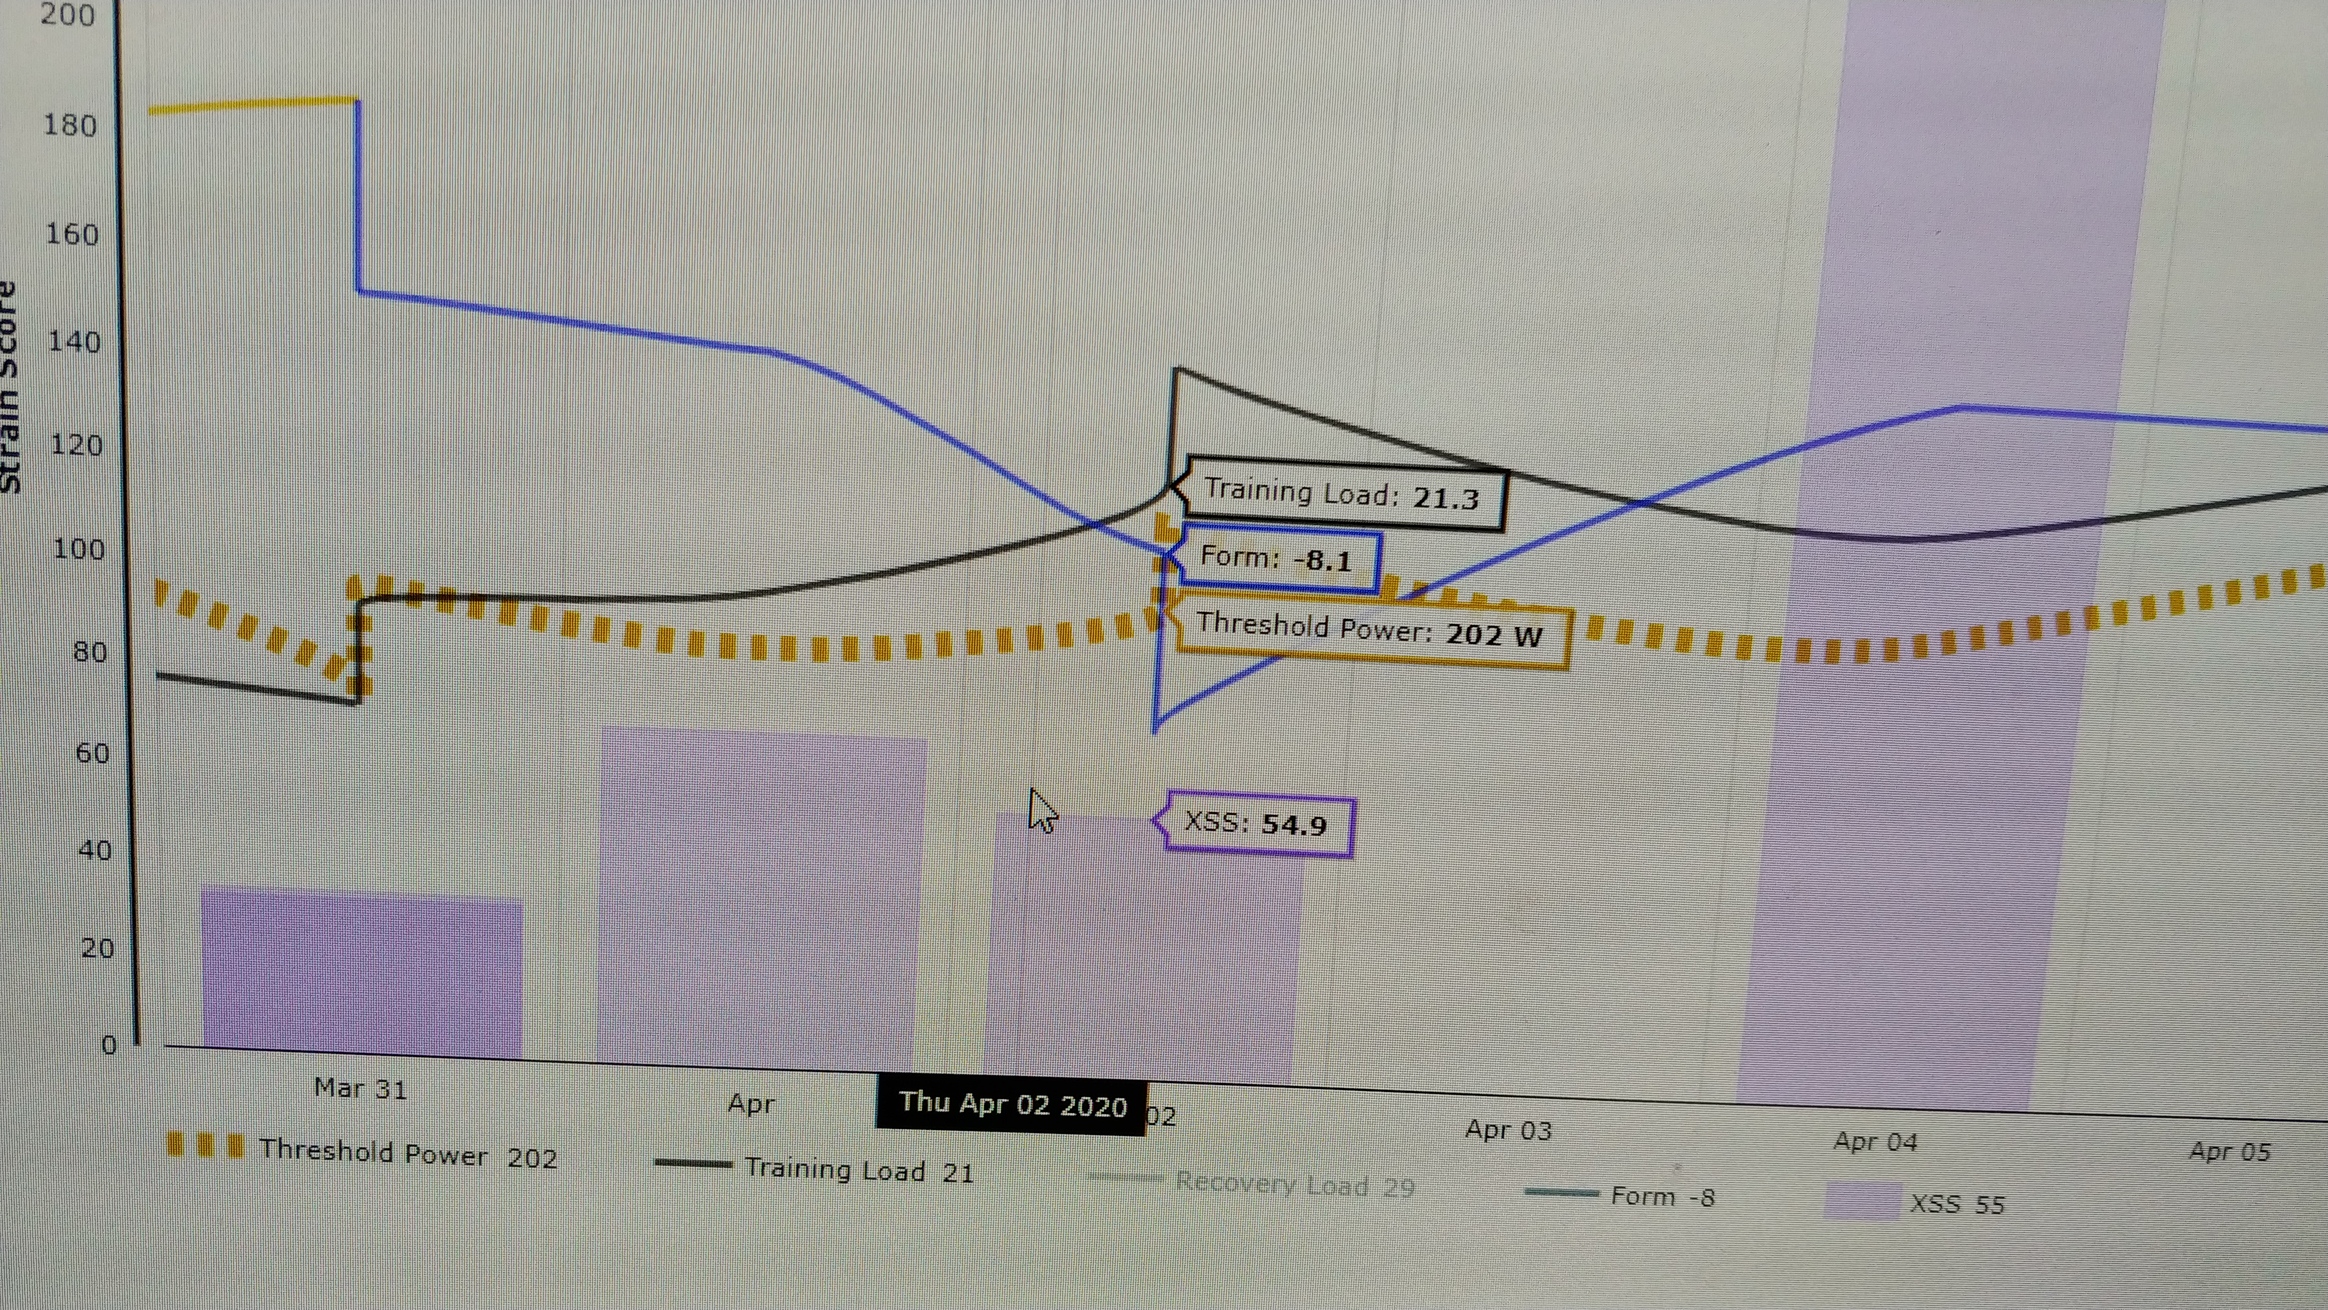
When you started your workout yesterday, you had a form of -8.1 (I think we agree on that ). Immediately after completing that workout when you checked, you had a form of -10.5, which will continue to increase over time until your next planned activity. We don’t graph it every minute…only when there is an activity (or the ‘current’ value). So, when you check your freshness now, it has increased from =10.5 to -8.6. If you don’t do a workout, the value is going to keep changing (and increasing) until you hit your next activity. You currently have one scheduled for tomorrow, which has a projected freshness of -2.5 (provided you don’t train today).
Yesterday’s form of -8.1 (left) and your current form of -8.6 (right) which will continue to increase until you perform your next activity (when it will drop a bunch again). Perhaps what can make it confusing to understand is that we don’t graph the full trajectory, but only the points at which more strain are applied. As I mentioned, the ideal scenario would be that we plot every minute of your form, but that’s a bit of a tall order for the time being.
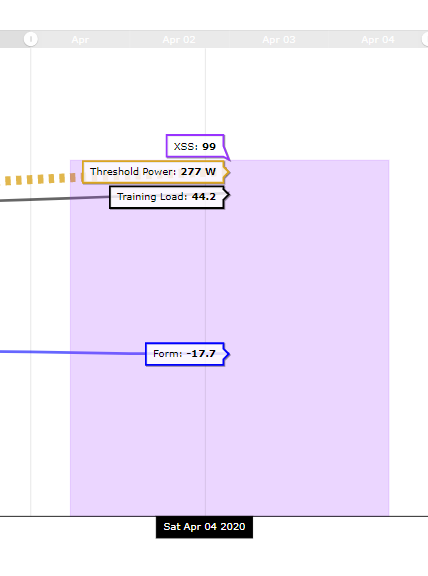
this make sense as you describe this and I am wondering, fit in this description my form value from that picture, where my form is -19today (2nd pic from bottom)?
That’s likely what your form was ~14 hours ago. After you upload a ride, form takes a nosedive downwards and slowly creeps back up until the next activity. The actual dive & recovery can’t really be captured by the charting software that we’re using at the time, it only plots the data points when there is other data to chart (i.e. XSS) or the live value of the form (which is always changing)
 ) and the best will be to used XATA Advisor and planner. I still will use other part of chart, strain, signature, but will stay away from xpmc(with some exaggerating).
 ). Immediately after completing that workout when you checked, you had a form of -10.5, which will continue to increase over time until your next planned activity. We don’t graph it every minute…only when there is an activity (or the ‘current’ value). So, when you check your freshness now, it has increased from =10.5 to -8.6. If you don’t do a workout, the value is going to keep changing (and increasing) until you hit your next activity. You currently have one scheduled for tomorrow, which has a projected freshness of -2.5 (provided you don’t train today).