Can someone please tell me how I interpret the following dashboard in MPA:
I tried the support page but it’s not working at the time of this post.
Rob
Can someone please tell me how I interpret the following dashboard in MPA:
I tried the support page but it’s not working at the time of this post.
Rob
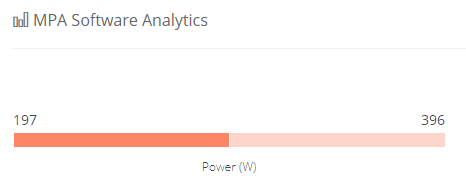
197 Average, 396 Max
Sorry - I should have been more specific. I know what the numbers mean (although on this specific workout there is no plot of power anywhere near 396), but what does the dark shade halfway across mean?
Hmm… I would guess it’s a graphical representation of above numbers. 197 is close to half of 396.
I looked through few activities and it holds true, except for speed:
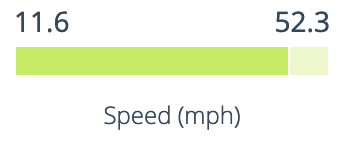
It seems to be reversed. May be it’s a bug?
Good one! I never thought of that.
Thanks.
Must have something to do with outdoor ride speed data but I haven’t been able to figure it out yet. 