I have seen it again and again since using Xert, but it was never as obvious as this time: The predicted maximal power from the power-duration model of a given fitness signature is lower than the power you need to arrive at that signature.
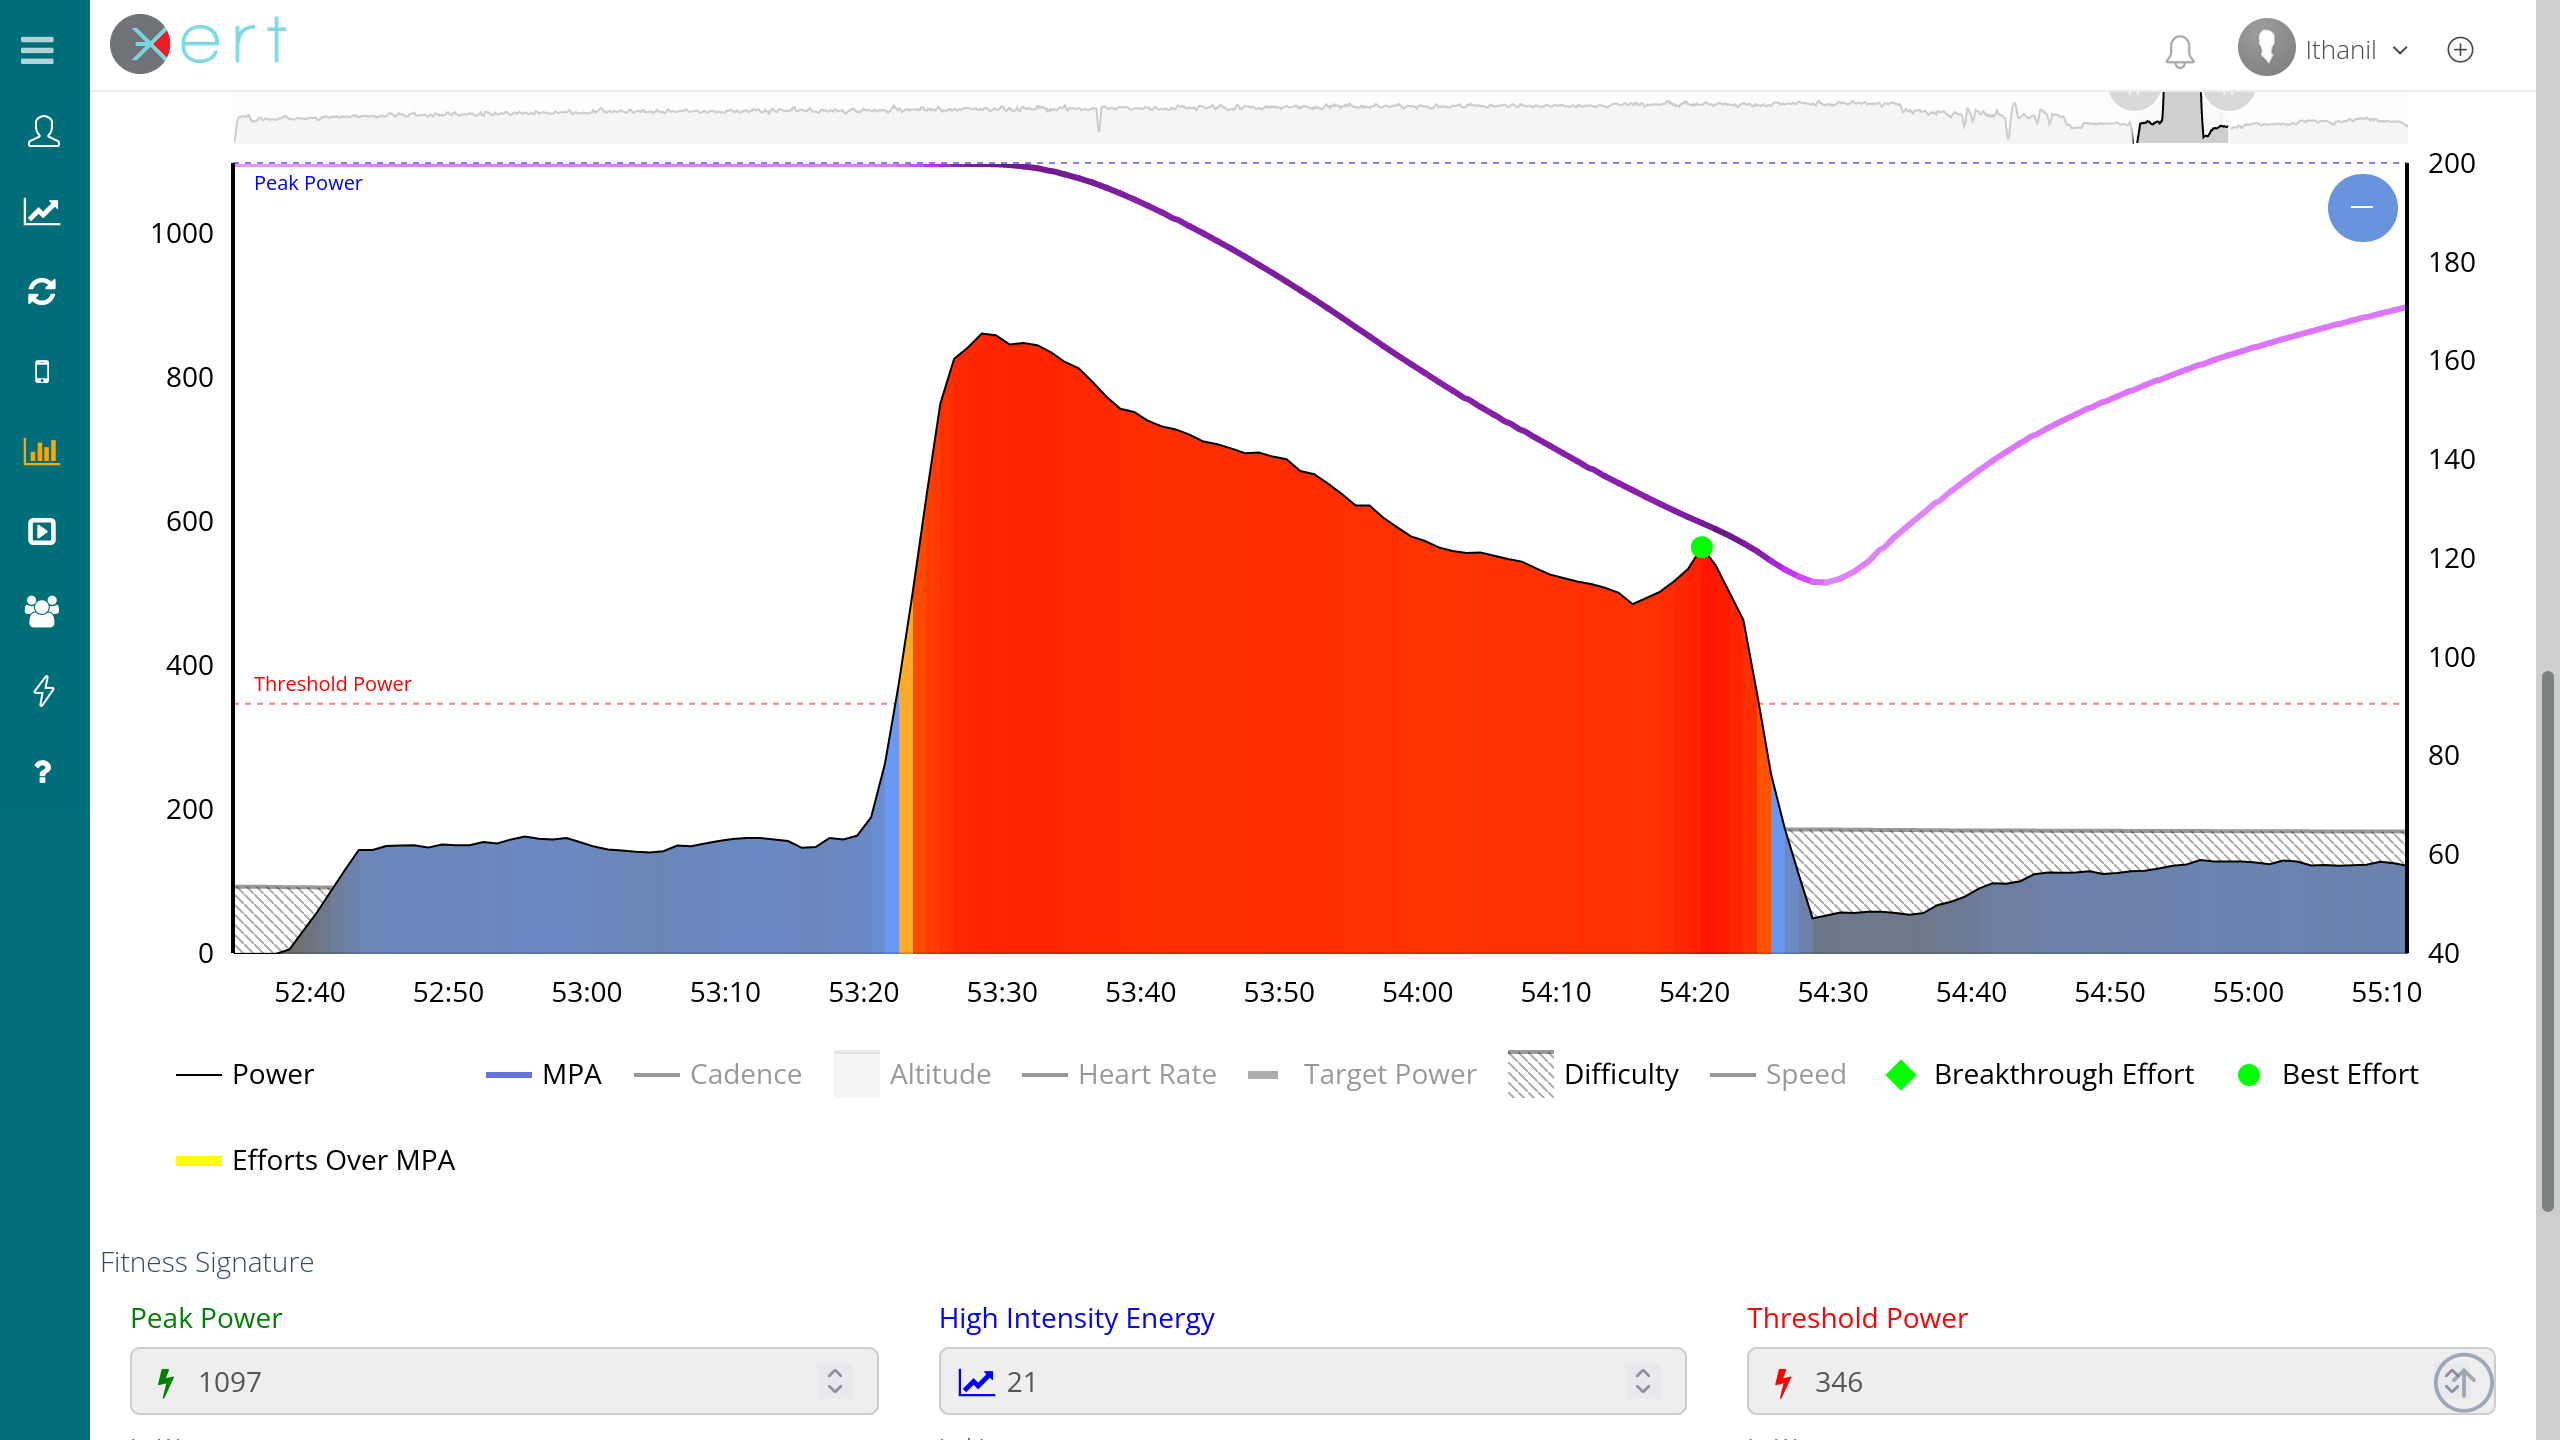
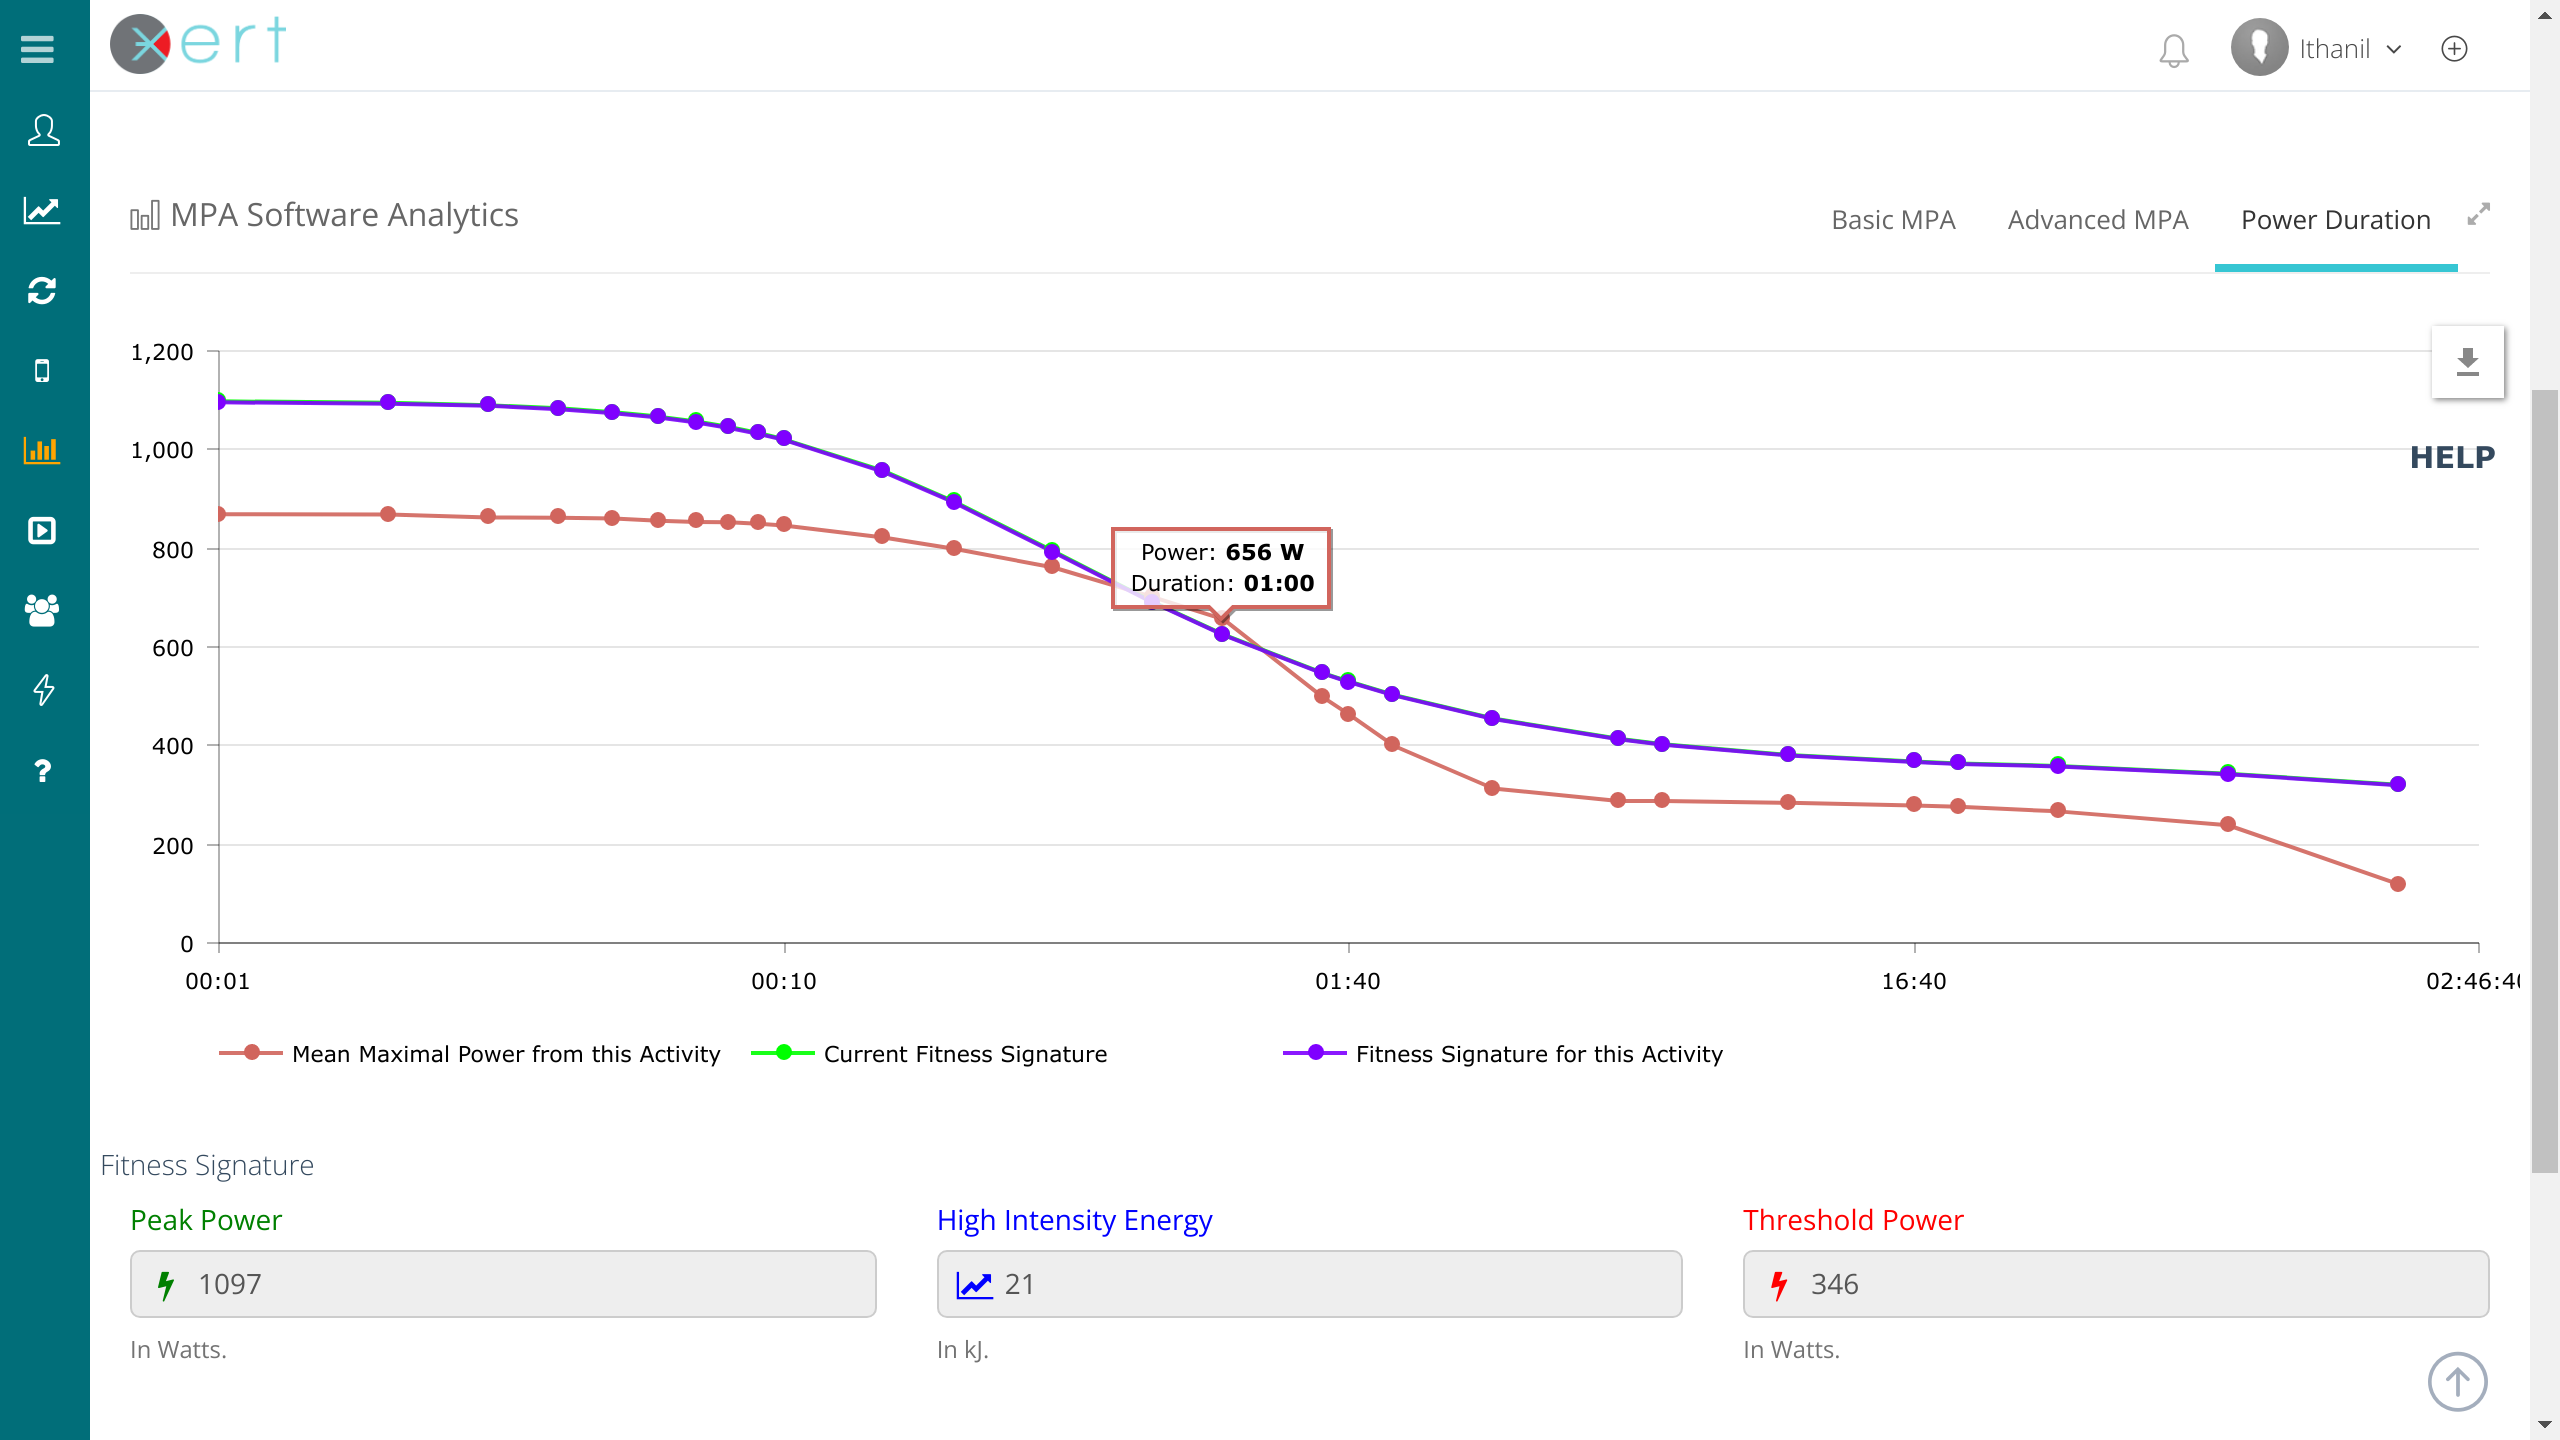
For example, today I did a 1 minute max effort of 657W, which was a significant PB but still dragged down my HIE (which was more derived from 3-5min efforts). In the screenshot below you can see the MPA analysis, where I have already adjusted the HIE back up slightly (from 20.4 or so to 21kJ, still lower than my typical in-season value of ~23kJ):
This slightly annoying downregulation of my HIE from 30-60 second efforts is nothing new to me and usually I push it back up a bit, because otherwise it is just too low to model my power over slightly longer durations correctly.
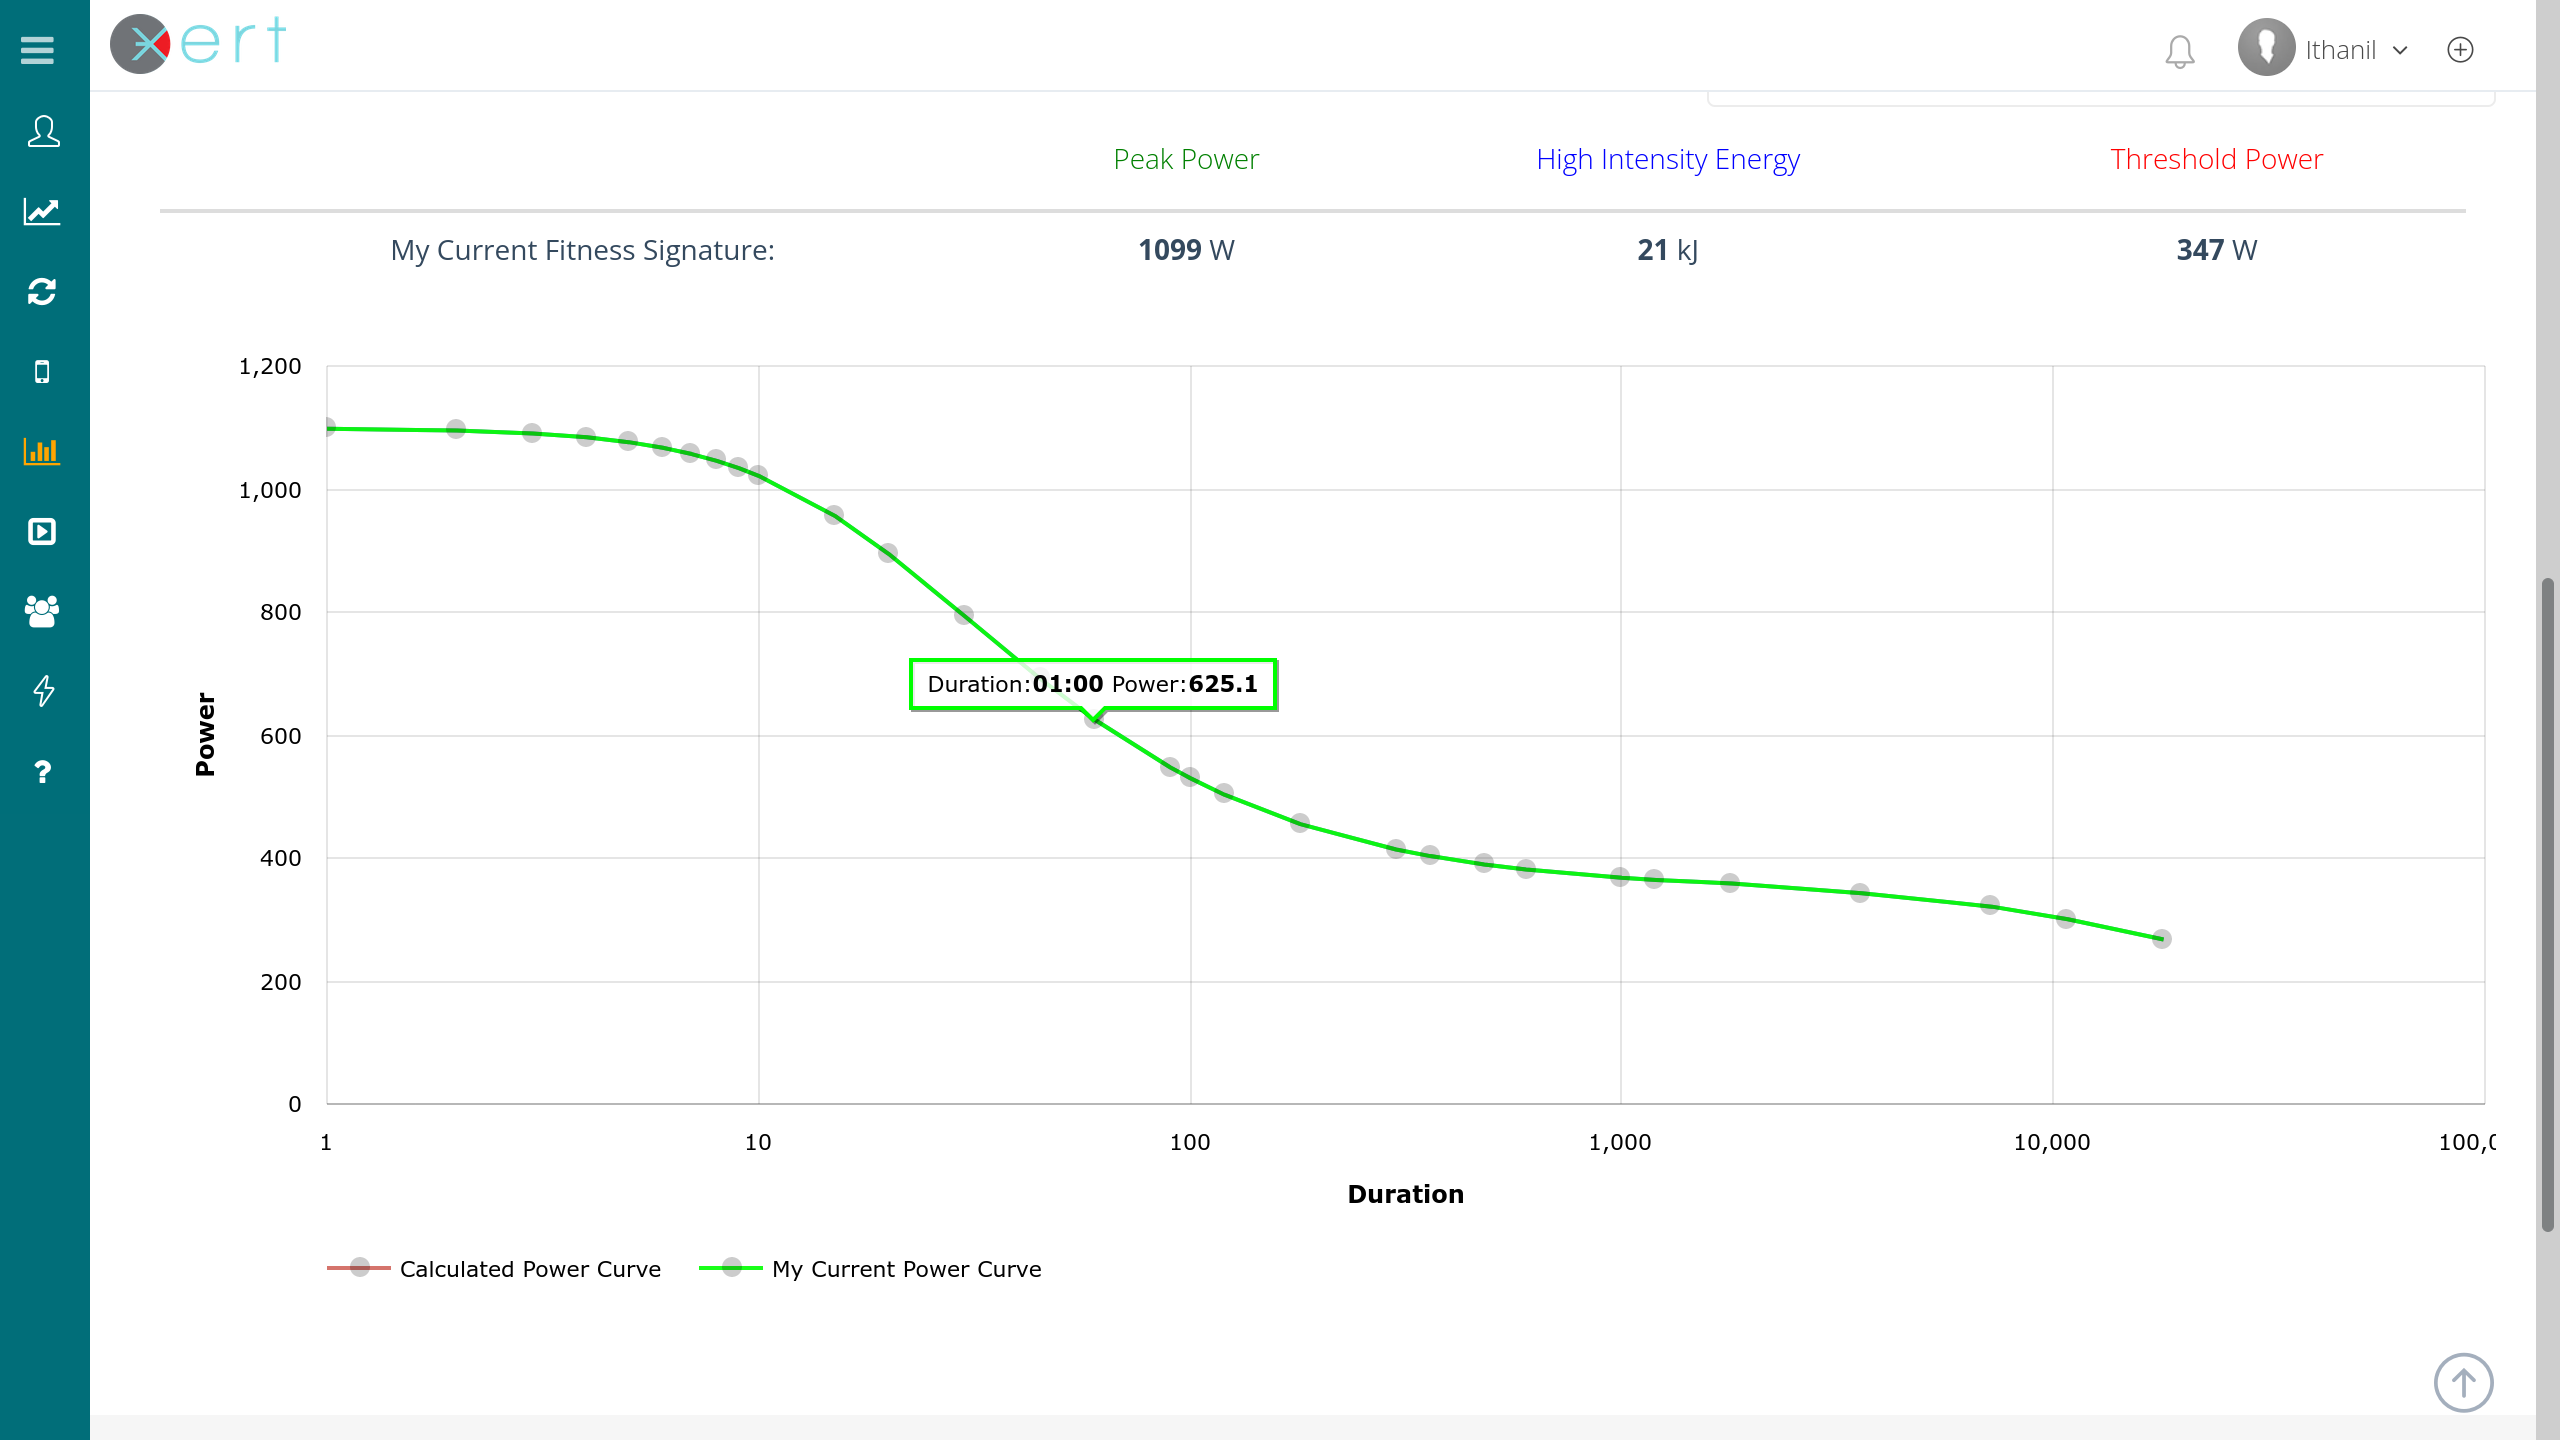
So far so “good”, but when I now look at the power-duration curve, it predicts only 625W 1 minute power, even with the manually increased HIE value. (can’t upload a second screenshot…)
With the original HIE value it would be even lower, so in the end the predicted 1min power is almost 10% lower than what was done to achieve at the signature. PP and TP values should be sufficiently accurate (PP may be slightly high and TP slightly low currently, but not too far off).
So can someone explain what is going on here? Is it a known issue and will be improved? Because I know I see things like that since I started using Xert 18 months ago. With everything else I’m very happy…
The reason for this is a bit subtle and it’s the difference between sustaining a fixed power and averaging that same power. In your effort, you ended the MMP effort below the average power for the effort and MPA dropped below the average too.
There is some research to support this phenonenon and it highlights the issue with using MMP data rather than MPA in establishing TP and HIE.
In some very unique situations, therefore, it is possible to average a bit higher power with a positive split effort than with a constant, steady effort.
So far I was only aware of the phenomenon that average power is often lower than what could be sustained in a perfectly steady effort, especially if the effort is close to threshold power. My understanding of that was that you can’t recover below TP as quickly as you can fatigue yourself above TP.
For efforts consistenly way above TP I thought it wouldn’t matter too much how exactly the average power is generated, although somewhere I read the advice that the best power over 1 min is typically achieved with a positive split. This is what I implemented here.
Anyway, still there remains the problem that my HIE for shorter efforts (<= 1min) is lower than that for longer efforts (like 2,5-5min). But I guess a 3 parameter model is just not enough to perfectly model physiology.
I would be very happy if you could point me towards the research you mentioned. Sounds quite interesting!
I looked quickly but couldn’t locate yet. You could check or research from Annie Vanhatalo. I’m pretty sure there was a study that showed variable power was better than constant power for CP testing.
Maximal 1 minute efforts are very difficult to execute perfectly and depend a lot on gearing, standing/sitting and timing the shifts perfect and not giving up. If you grind too tall a gear, even for a few seconds, your max won’t be attainable.
3 parameters are all that is needed for the vast majority of situations I’ve seen. There are additional parameters that govern other aspects of performance which are absolutely necessary. Modeling a PD curve for less than an hour, isn’t one. If you add another parameter, you won’t be able solve for it without compromising the others.
Maybe another parameter might be able to measure an athlete’s ability to change gears properly?
FYI, this effort was done on an indoor/smart bike with virtual gearing, so I was able to fine-tune the resistance without delay or reducing tension, to match my preferred standing/sitting cadences. I was standing for about the first 30 seconds, sat down for most of the rest, and stood up again in the very end. I think I would have made less power in real world conditions due to gear shifts, even though my peak power is better on real bikes. PP is consistently best on my MTB, I think due to leverage from the wide bars. (and no it’s not due to different power meters)
So this brings me to my reply regarding the 3 parameter model. I understand that it is pretty good for describing cycling performance in perfect lab conditions (i.e. fixed position, cadence, inertia, body temperature(!), altitude, no vibrations and body tension requirements, not having to actually control a bike ) and that simply introducing more parameters doesn’t improve it necessarily.
But in real field testing I see strong influence from all the things I mentioned (especially temperature and inertia/going uphill or flat being extremely impactful for me), which really does complicate deriving fitness signatures and putting them to good use. And I didn’t even mention day to day variations in form yet.
Furthermore, I’m very convinced that even under perfect conditions I’m simply unable to achieve a breakthrough or even get close to MPA within efforts below 60sec, for a signature that otherwise describes peak power and more aerobic efforts of like 2,3-20 minutes pretty well. And it’s not due to a lack of effort or shifting ability.
I’ve also noticed that in max sprints my power seems to drop off faster than Xert’s PD curve seems to suggest.
Still, I’m a big fan of Xert and actually think it is overall the best system available right now. But there remains a way to go if it comes to accurately predicting real world performances, in my opinion. And not just beyond the magical one hour.


 ) and that simply introducing more parameters doesn’t improve it necessarily.