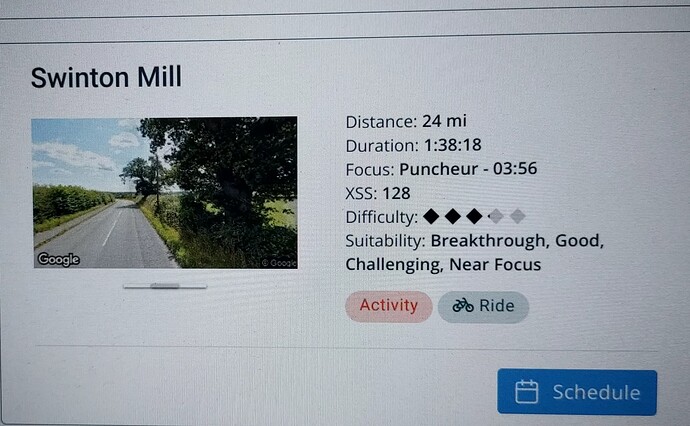
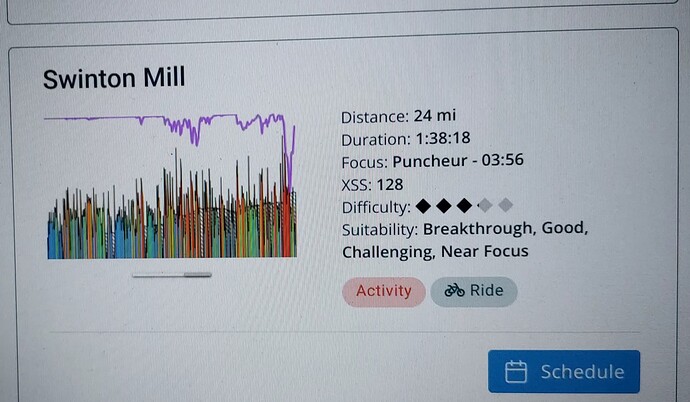
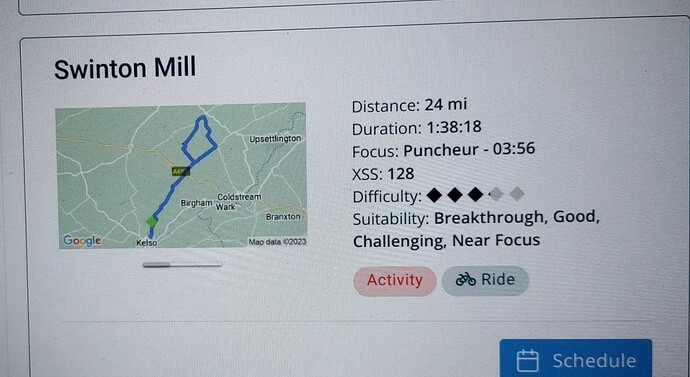
I have looked but I cannot see a way to stop the images from a Google for my Activities. These images seem quite useless and I would rather see the stats and/or map. I don’t see a point in a random photo. Is there a way to disable this?
Are you talking about activity reports posted to Strava?
First off you can disable that on XO under Strava sync and Strava maps/stats will display instead.
BT reports include a background Google photo where the BT occurred on the route. The photo is not random. Swipe to the right (on a phone) to view map for the outdoor activity.
There is a rotating set of cycling related photos for indoor workout reports.
I think he is talking abut the Google images that seem to get pulled through to xert when you do an outdoor ride and sync it to xert. Images of a point during your ride where it appears a google streetview image is used.
Hmm… I’m not finding any entries like that.
I have some with two slides – map and power chart – plus a bunch with only a map since I’ve been riding a new bike outdoors that doesn’t have power (yet).
I would find the images useful though. Oh yeah, I remember that spot. ![]()
It’s just the google street view taken from the place where you had your Breakthrough effort (if applicable). There isn’t a way to disable it.
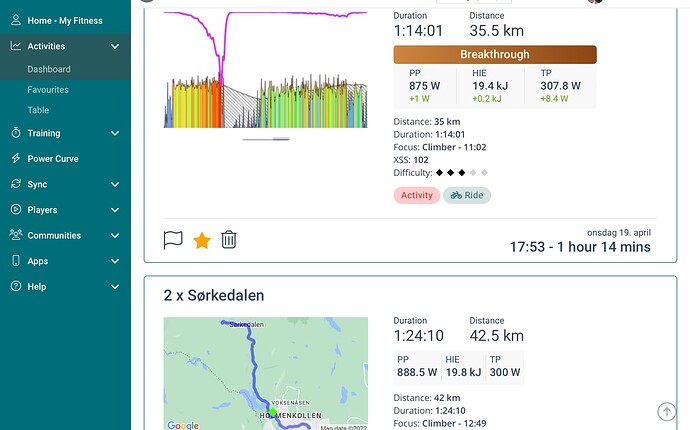
However, you can click/tap on the edges of the MPA/map/image to toggle between the different views from the activities dashboard:
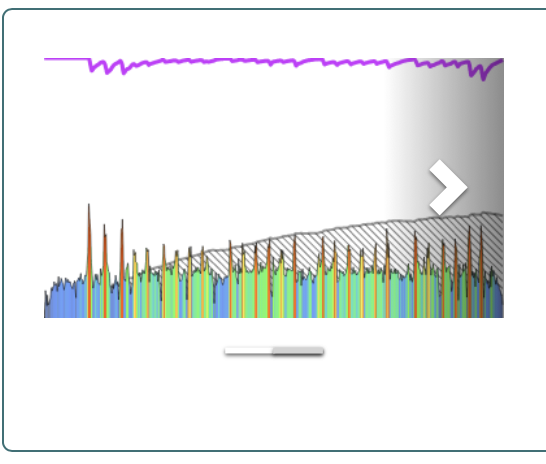
Thank you. I guess I was not clear enough. Thanks for clarifying and answering. Yes, I meant outdoor rides that sync to xert.
Funny, I never associated the seemingly random images with “near breakthroughs” and “breakthroughs”.
Okay, now I see one. I’m on Slow Decay.
I have to go back to April 4th which was my last BT.
The photo is on the climb where that occurred.
Same here, I never understood the photo where of the breakthrough location until someone at the Xert support mentioned it to me. To me it looked a bit random if an activity got a photo or not, and same with the location.
I think Xert should have a text like “Breakthrough” or “Breakthrough location” on the photo. Also, different numbers items to show for each activity creates a cluttered screen as the activities shows different things at the same time.
Btw, if would be useful if one could search for “breakthrough” on the dashboard page and the list of activities filtered down. Now you have to use the table view and sort by breakthroughs — and then you will not see the maps or photos.
Best place to view BTs in sequence is the Progression charts starting with the circles (size and color matter), hover for description, then drill down to view details for each one,
For best results view the charts on a PC/laptop/tablet.
On a phone switch to landscape and change browser view to desktop mode.
