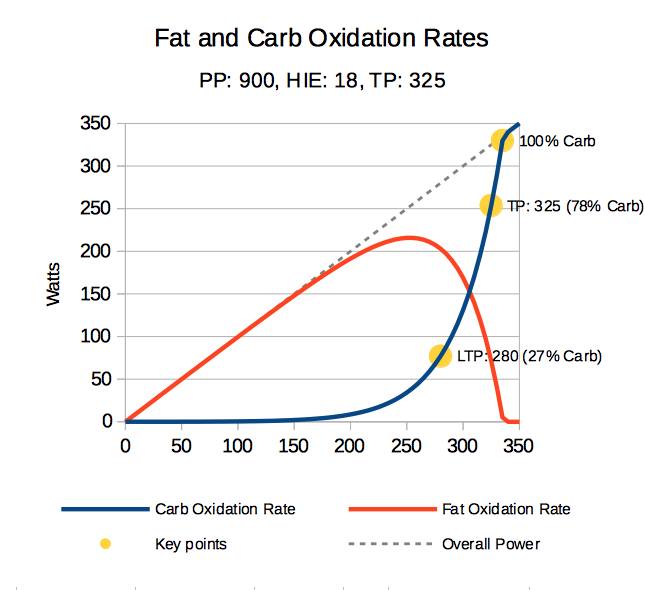
Given XERT can estimate the given carbohydrate and fat usage for a given power level, why can’t you provide these values to us in graphical and tabular forms? Below is an example chart of yours that shows this.
With this data, it would also be possible to see the range at which fat usage is at its maximum and where carbohydrate usage is within a range that may be refuelled (60 to 90 g of carbs per hour). The power range where maximum fat usage overlaps the maximum carb refuel window would be the FatMax Zone.
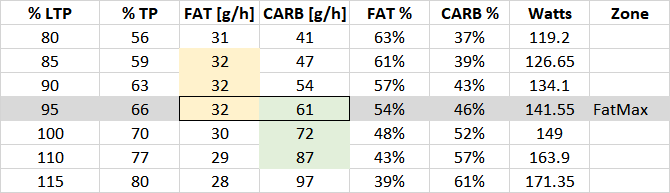
I did this with my signature last year by creating dummy files at various power levels and analysing them in XERT. This is what I found.
Generally speaking, just below LTP would likely be your “fatmax”. Pacing for carb utilitzation is something we have thought about. Sort of like a “bonk-o-meter”. Yet another one of the great ideas we’d love to be able to get to sooner rather than later.
Thank you for putting this together. I was looking for this table and was thinking about trying to create it. At a minimum, this table would be a good add to the information page for this widget/data field
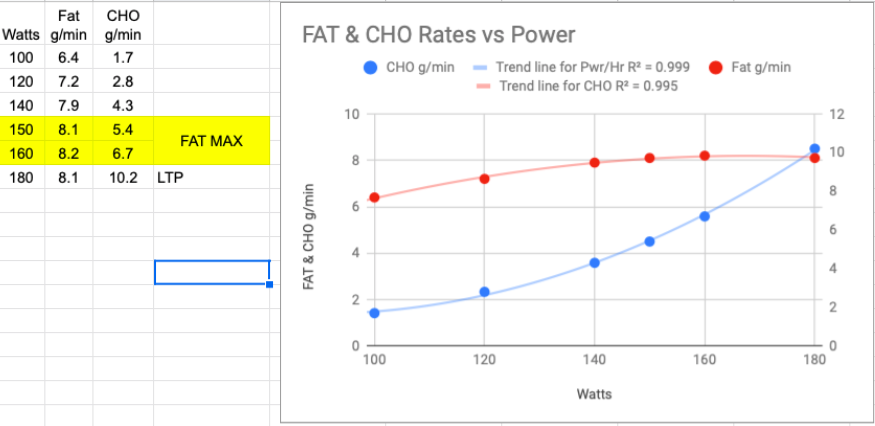
If you use carb and fat rates in W as data fields it is easy to figure out the threshold power at which fat oxidation rate reaches a maximum and carbs oxidation rate starts to rise rapidly. In my case this happens around 75% TP which in the Cogan’s zone model is high zone 2 low zone 3. My LTP is around 90%TP which is clearly above this fatmax range. I plan for the beginning of next season doing long rides targeting fatmax with the help of fat and carbs data fields in my Garmin.
This is worth a read if you are interested in this subject. It adds a little color around around potential deviation between “Individual” FATMAX vs “Group” FATMAX calculations. It also provides some tips around fueling to optimize FATMAX.
52%, 60% and 70% of VO2max are at the same relative fat burning range, i.e. the curve is “flat” in these ranges.
Fat burning increases with depletion of carbohydrates, i.e the proportion of fat oxidation is higher as you fatigue. Anecdotally, I’ve often heard of athletes that feel that intensities at LTP get easier as the ride progresses.
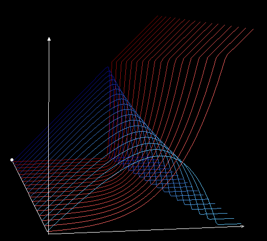
We’ve had a model for this since the beginning. Here is an old chart we created that shows both the “flatness” of fat burning as well as what happens during depletion. The X/Y axes represent total power / substrate contribution with blue being fat and red carbs. The Z axis is depletion of carbs. You can see how the fat contribution increases and the carb contribution decreases until an absolute bonk at the very back where no carbs are consumed at all at low intensities. This is a theoretical limit.
We’re in the process of developing an improved model for this where the signature, XSS and substrate usage are fully combined. Lots of work involved with a lot more complexity than what we currently have.