I take it “Overall Form” is the “Form” number on the progression chart. What is “High + Peak Form” as described on http://baronbiosys.com/glossary/training-status-and-form/ and where can you find that metric?
Hi Steve, good question. We don’t report that number anywhere, it’s handled behind the scenes. Similar in concept to regular form, High + Peak Form is the difference between High/Peak Training Loads and Recovery Loads. You can view your peak/high training loads by changing the XPMS to the ‘Fitness Signatures’ page and enabling high & peak training loads. Cheers.
sorry to dig up old forum posts… is there a reason why the high and peak recovery load or high/peak form isnt shown? right now my TL is 40.4 xss and 39.9 of that is low TL. 0.1 is peak and 0.4 is high. basically it seams like if i do even a single 1000 watt sprint, i’ll generate yellow stars then? what is a good target ramp rate for high and peak training load? i see my peak TL only ever got to 2 xss in 2020 and 1.8 xss in 2021… is that good at all or just shows i never really truly focused on being a good road/crit racer? i’ll admit training for and performing my local monthly 20’ TT race does require a ton of recovery and limits my training readinss for serious sprinting and vO2 max workouts…
and on the above link looking at this chart… when i try to identify where i fall on this chart…
given: TL = 41 which equals “X” in the graph
and my form is -18…
and my freshness fedback =0
in order for my form to be equal to -3x on the graph… if i’m doing the math right, my form would need to be -123 for it to be equal to 3x my TL of 41…
my current form is actually -0.44x where X is my TL.so i can approximate that position on the chart. see picture.
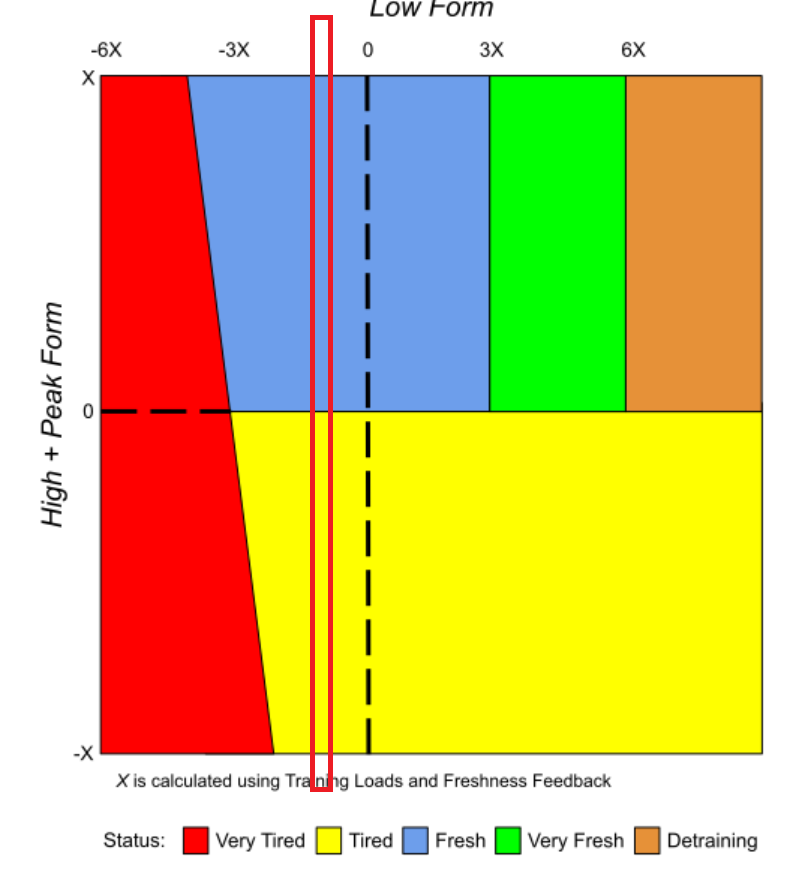
so regardless of where my high and peak form is, i should have either blue or yellow stars…
is the true graph here represented very different and behind the scenes? IE “proprietary or a trade secret”?
oh i see where my missnderstanding is… the units on this graph x axis should be -0.3x and -0.6x…
1 Like