using Rualyze on 2 files one was a slow ramp up from 50% TP to 90% the other was Endurance builder 1 edited to start at 50% TP and then use % TP to build to 100 % TP for the top power setting. Runalyze gave exactly the same aerobic threshold (AeT) for both rides to the watt. So it appears that the mode of operation for the power ramp may not be that critical? again more data will tell the story. The AeT is lower than my current signature LTP but we will see if they converge with time. My signature is a bit off right now is my current guess.
1 Like
hey Scott, here is an answer to my concern with your approach to DFA a1 testing from Bruce Rogers on youtube, he specifically addresses the approach you suggest and states he now uses the rolling window : HRV relevance to zone training - YouTube
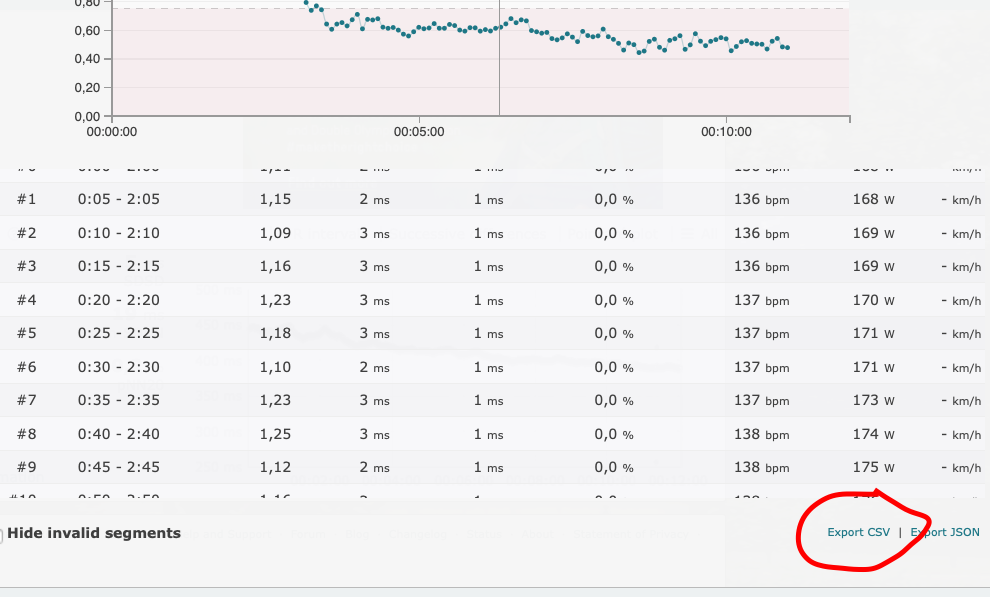
Hope you find this helpful. The Runalyze program does this very nicely, you can download the FIT file then merge the HRV logger RR file and presto it gives you the ability to look at the DFA a1 with all sorts of options. you can select portions of a curve, vary the rolling window as you want, the over lap (the difference between window calculations ie 5 second rolling 2 minute window. Really quite nice and it does a lest squares fit through your power vs DFA a1 plot and suggests the aerobic threshold. I still think some care needs to be taken in cases where your DFA a1 bounces around a bit. It can cause the fit line to waver and I prefer to look for the first time it crosses the 0.75 line. Anyhow still learning but it is a cool option and seems to be gaining strength as a valid approach to the determination of the first break point.
1 Like
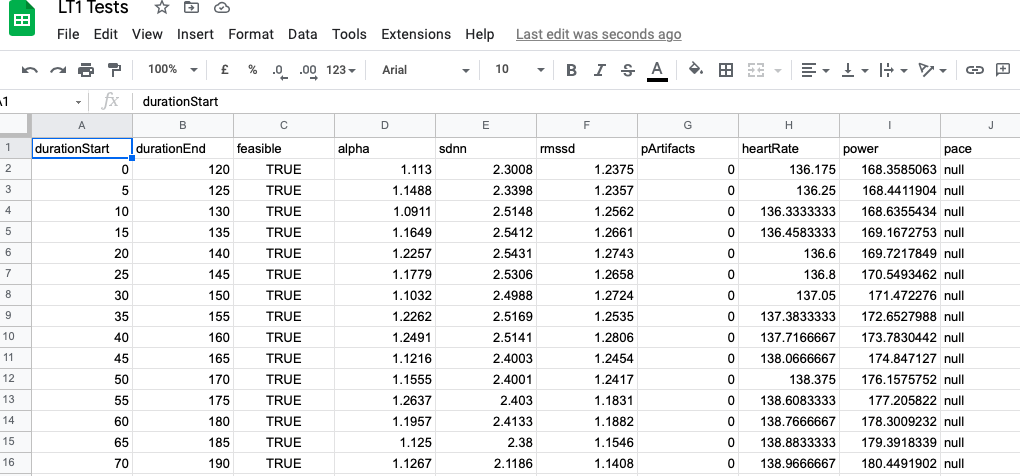
I download the data into Google sheets and make a chart of it. Interestingly I generally get a what I assume is a better fit to the points (the R squared numbers higher) using a 2 or 3 order polynomial. My Aet according to this method and using a both continuous and stepped ramps has started giving me a much higher figure than my LTP. It really is a work in progress.
Also if you’ve got an Android phone the App “Fatmaxxer” monitors it in realtime but shows the data continuously not just every 2 minutes. It doesn’t log power though, just HR.
are you plotting the RR intervals? The DFA a1 is a fairly complicated equation and takes numerous steps to achieve the result of DFA a1. the a1 value is a slope of the function… The actual math is beyond me. There are program codes on line that one can use but it is not trivial in my limited understanding. If you are interested in some of the work the guys at Runalyze have doe they have a blog post: HRV: Improved estimation of DFA-alpha1 values – RUNALYZE. As Bruce Rogers points out the other usual calculations for HRV are uncorrelated to aerobic threshold.
If you look at the bottom right you can download the csv file from Runalyze so all the maths is done for you as it is just the data of the data points.
Sorry I did not understand what you were saying. Yes very interesting.
If as research is starting to imply that DFA a1 can pinpoint aerobic threshold and more recently anaerobic threshold then my big question to @xertedbrain or @ManofSteele how do LTP and TP relate to these 2 breakpoints. I assume TP is closely related to anaerobic threshold/ VT2 but does LTP correlate to aerobic threshold/ VT1? It seems to but I am not certain. Thereforee if the present direction of DFA a1 is on the mark, it will be even easier to locate these 2 markers.
3 Likes
FYI, all, I completed today the first iteration with FatMaxxer, PerfPRO, two Moxy5’s (left medial deltoid) and right vestas lateralis, along with attendant measures of hemoglobin from each site. PerfPRO is not yet ready to record direct, real-time output of DFA-a1, but concurrently I had that metric up on my android 7" Lenova Tablet while using my H10 HR strap.
The goal is to work toward whatever power output keeps me in the range of “optimum” DFAA! .50 - .99, adjusting the output as required to do that. The test I did as a baseline today was on a “Just Ride” 35’ effort. During that ride, I did several graded intensity efforts. The goal for my future workouts is to adjust effort in order to keep DFAA1 within the range of .50 - .99.
To be able to adjust those metrics on the fly, in real-time, for a person my age makes great sense, ensuring that I’m staying between what I understand to be LTP and THP in order to establish a baseline against which to measure graded increases in power output.
Fortunately the Coach I have is a helluva lot more sophisticated with this protocol than I… which of course is why I enlisted his services. 
Anthony
why .5 to .99 rather than .75 to .99 as the former would mean rising above DFa alpha 1 with .5 indicating LT2/VT2 if I’ve read things correctly?
.5 is usually about TP.
Hi Dave, I’m really early on in learning the metric, and I may well have misunderstood my coach, given that the audio our Zoom contact suffered from a screen cast from my Mac machine via Airplay to my TV across the room (no never mind that my hearing aids, like most others and despite their cost, are pretty ineffective). So, excuses aside, .5 represents the cross-over into anaerobic “space” as it were, so I was (inarticulately) describing the range of values on FatMaxxer as displayed on the android device I’m using, a Lenovo 7"tablet.
Nevertheless, thanks much for your reply because it gave me a chance to learn more about what I’m posting.
take care, Anthony
If you’ve not already, have a look at Bruce Rogers blog. There is a lot of very useful information about DFA stuff on it.
Basically keep Alpha1 as close to .75 as possible without going below it if you want to keep below the 1st Lactate Threshold and as such stimulate you Type 1 (Slow twitch) fibres maximally. The value of .5 takes you above your threshold although that absolute value hasn’t really been established properly and there will possibly be a lot more individual variation.
1 Like
I’m not overly concerned unless it drops below Defcon 4. 
2 Likes
an interesting new development from another Canadian training app, AI Endurance, they have been on the front edge of the wave regarding DFA A1 implementation and they are now working on using HRV data from say HRV 4 Training (right now only via Training Peaks Premium) but hopefully directly in near future along with DFA A1 to determine your readiness to perform a workout. It is an intriguing idea. I tend to agree with Marco Altini that DFA A1 may not be ready for all users as a means of determining your thresholds but if personalized along the same trends as HRV and resting HR then maybe it starts to have some value to the general public and not just the responders. Things are getting intreresting. more info:
1 Like