Connect IQ and final recorded activity discrepancy

I think I saw old topics showing that there is a difference between XSS shown by Connect IQ data field and final result listed in activities, but thought that this was solved long ago.

But I became suspicious recently when numbers I remember I saw on Garmin were different from what I later saw on the website, so decided to take a screenshot and check.

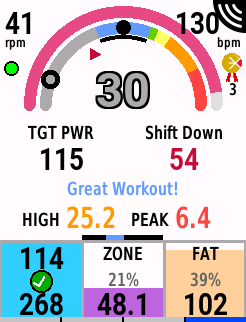
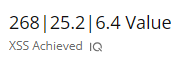
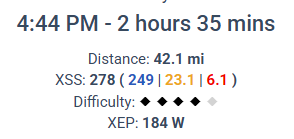
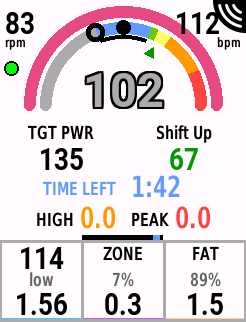
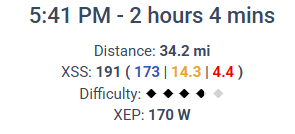
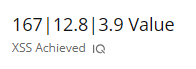
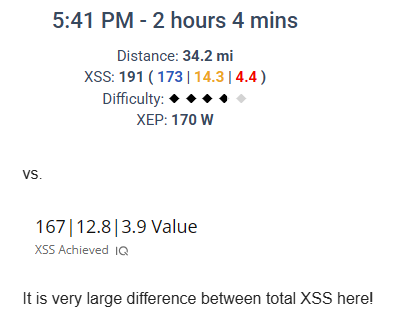
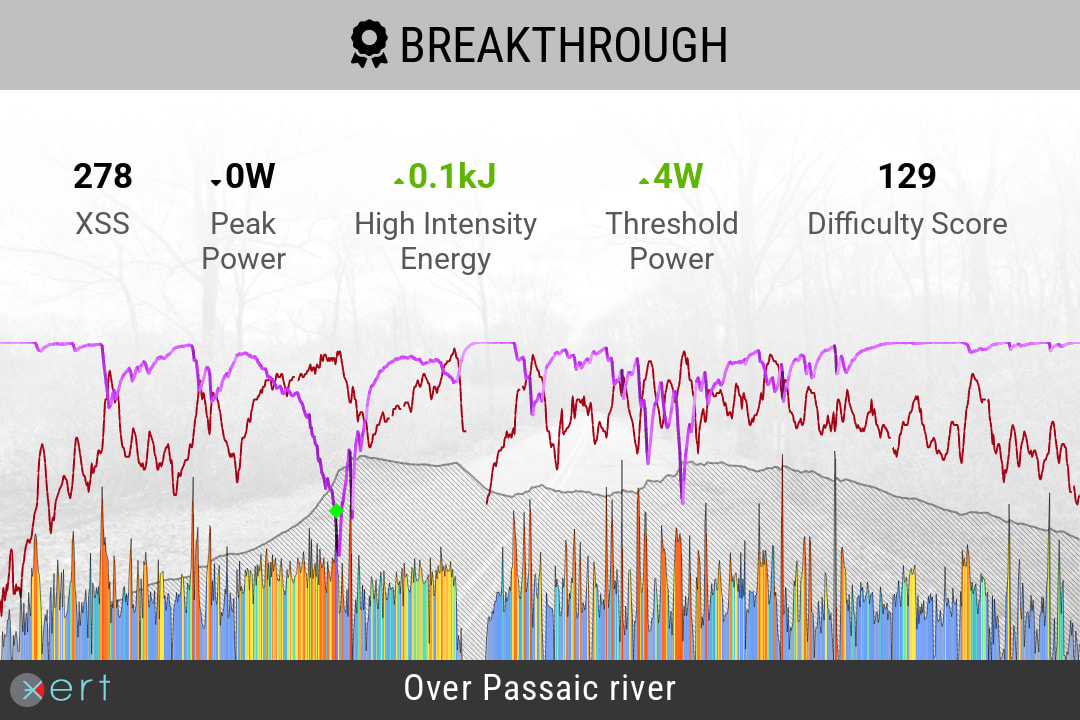
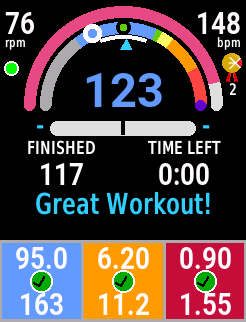
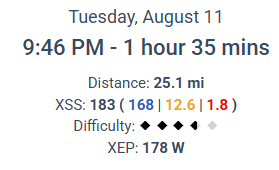
Turns out that XSS is indeed different - below is a screenshot from Edge 840 taken right before I ended the recording and the values shown on the web site for that same activity - why there is such noticeable difference? Activity was a virtual ride on TPV, dual recorded - fit file was produced by TrainingPeaks Virtual, but from the same source - Kickr Core.

Also - what’s up with extremely low target cadence recommendations? I often see target at mid-upper 6o for endurance rides and find this recommendation ridiculous.

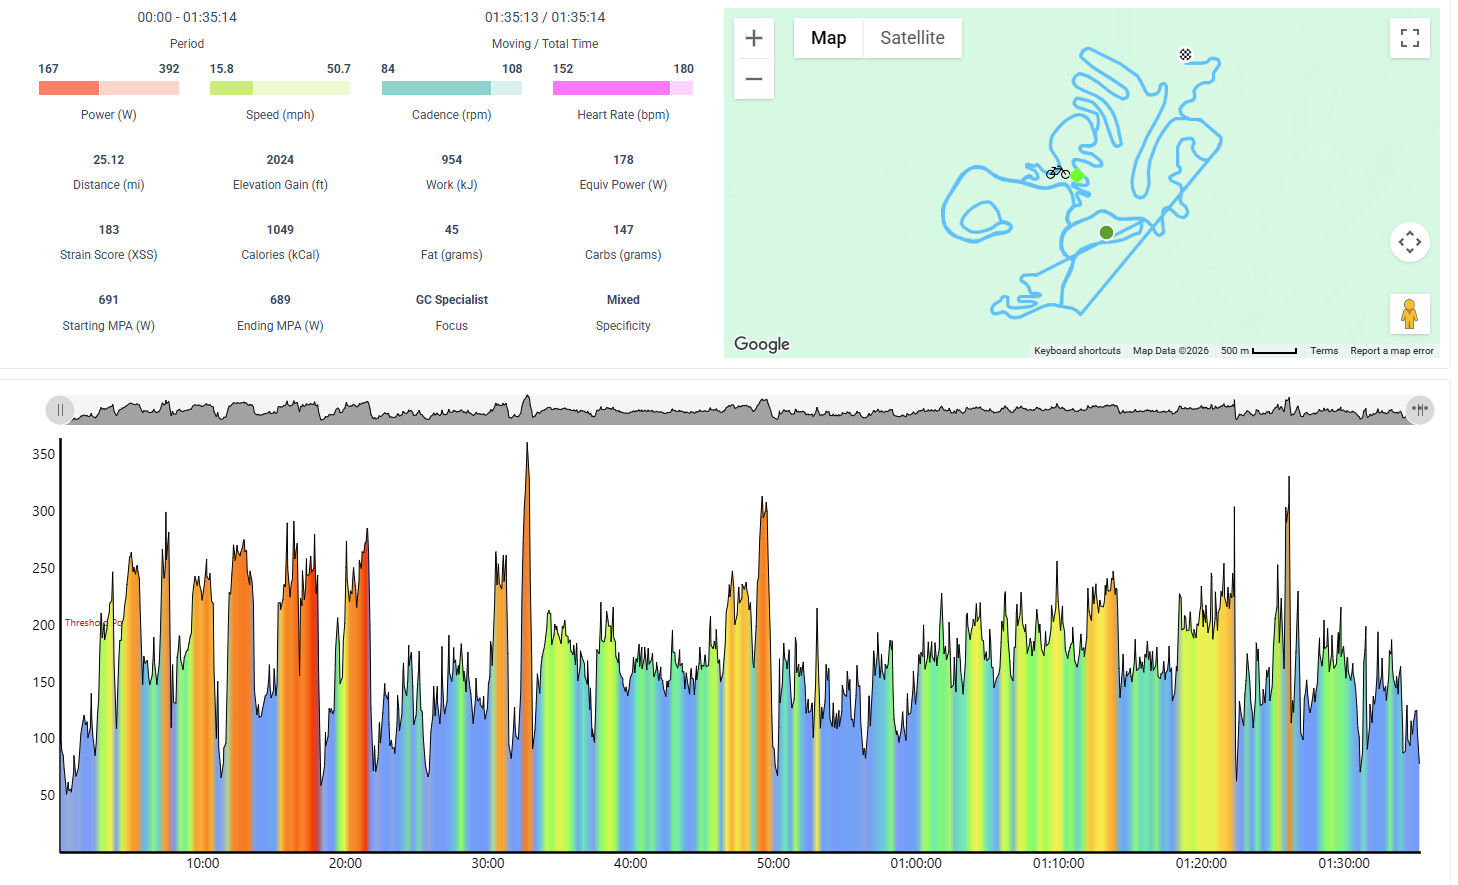
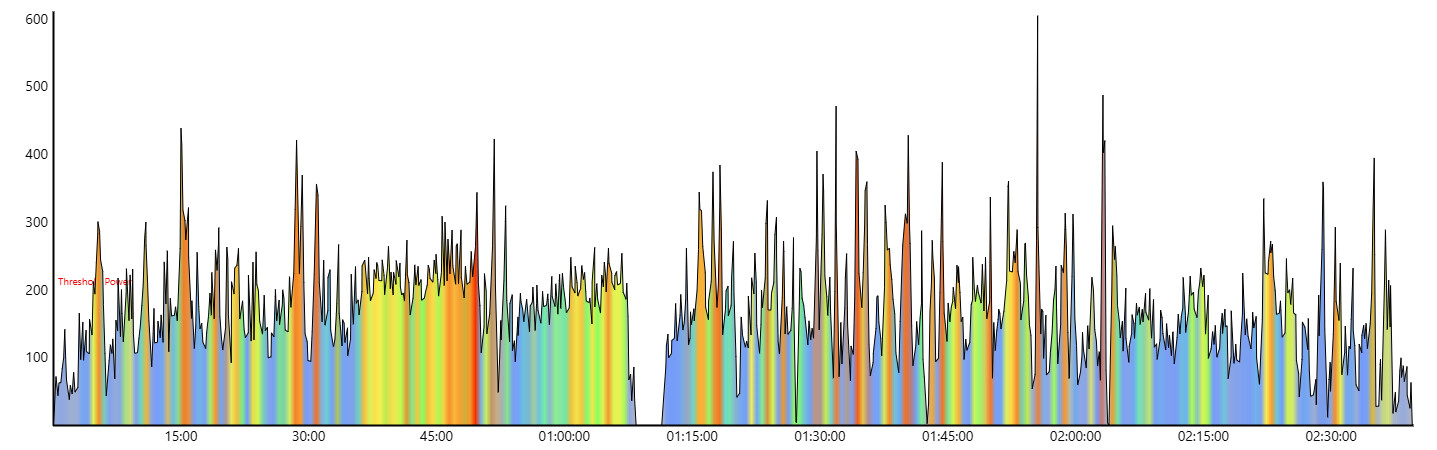
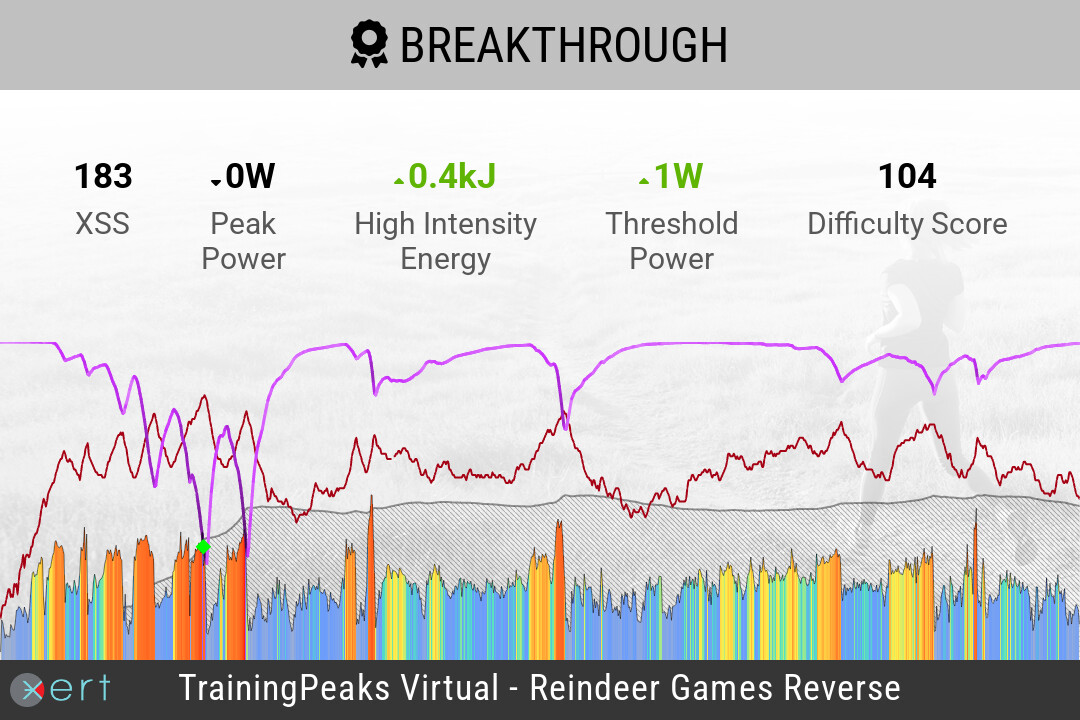
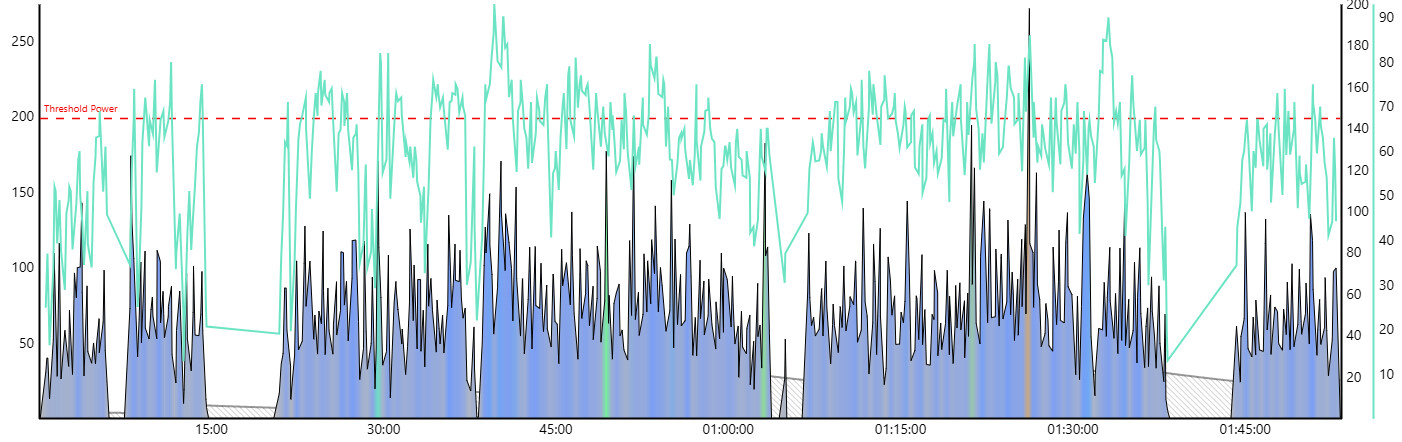
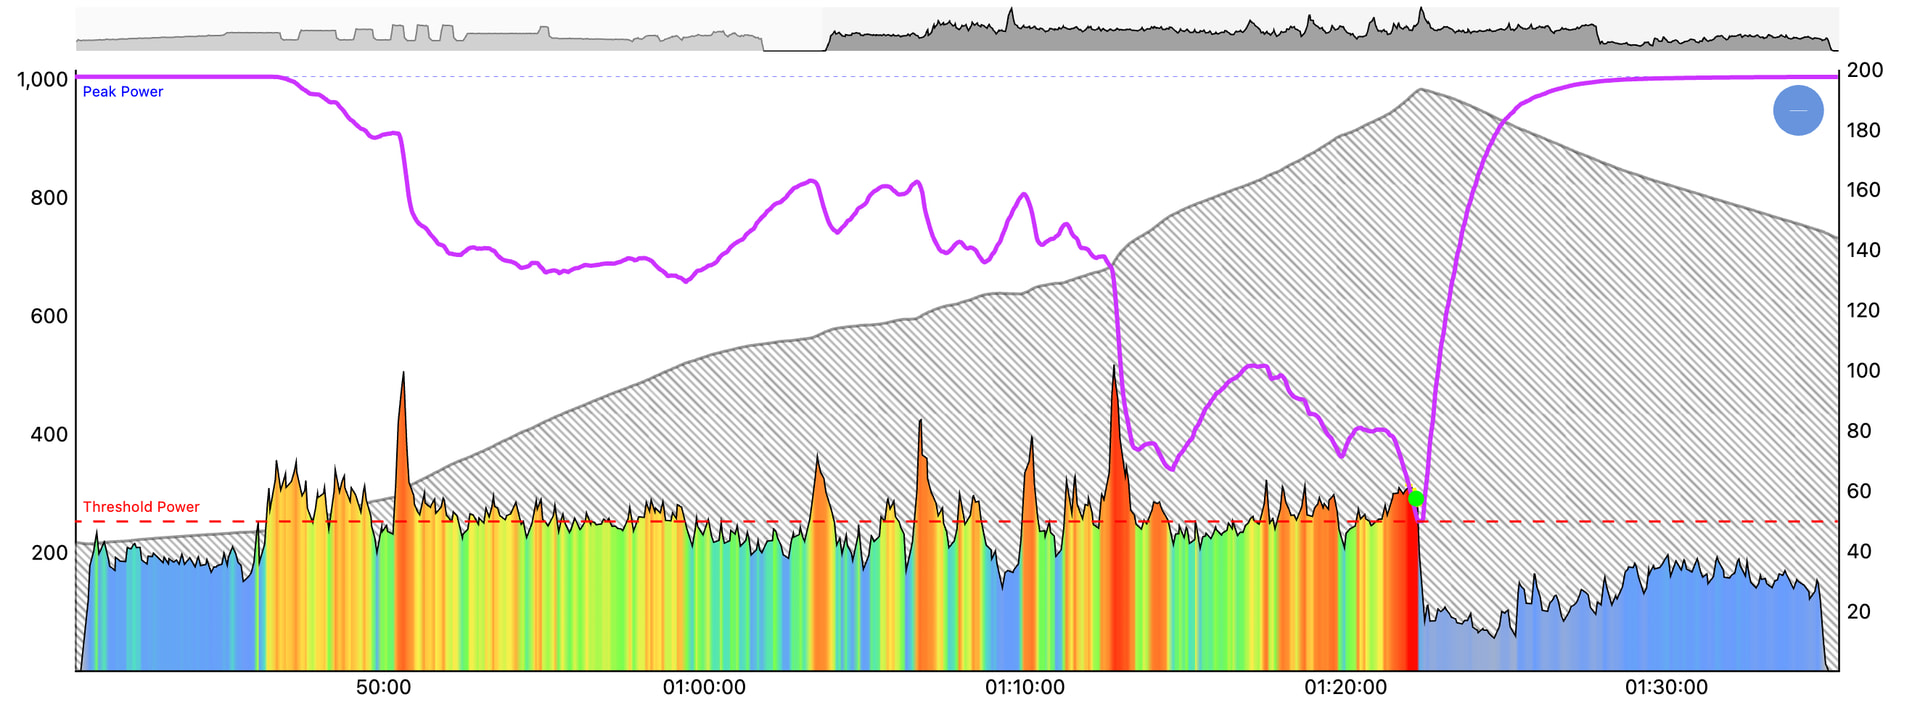
Can you post the summary report or power chart from that ride?

Here you go.

It gave me “silver” breakthrough.

This is just one example, if I have a chance, I’ll try to compare more rides, curious if there will be much difference if I record outdoor ride…

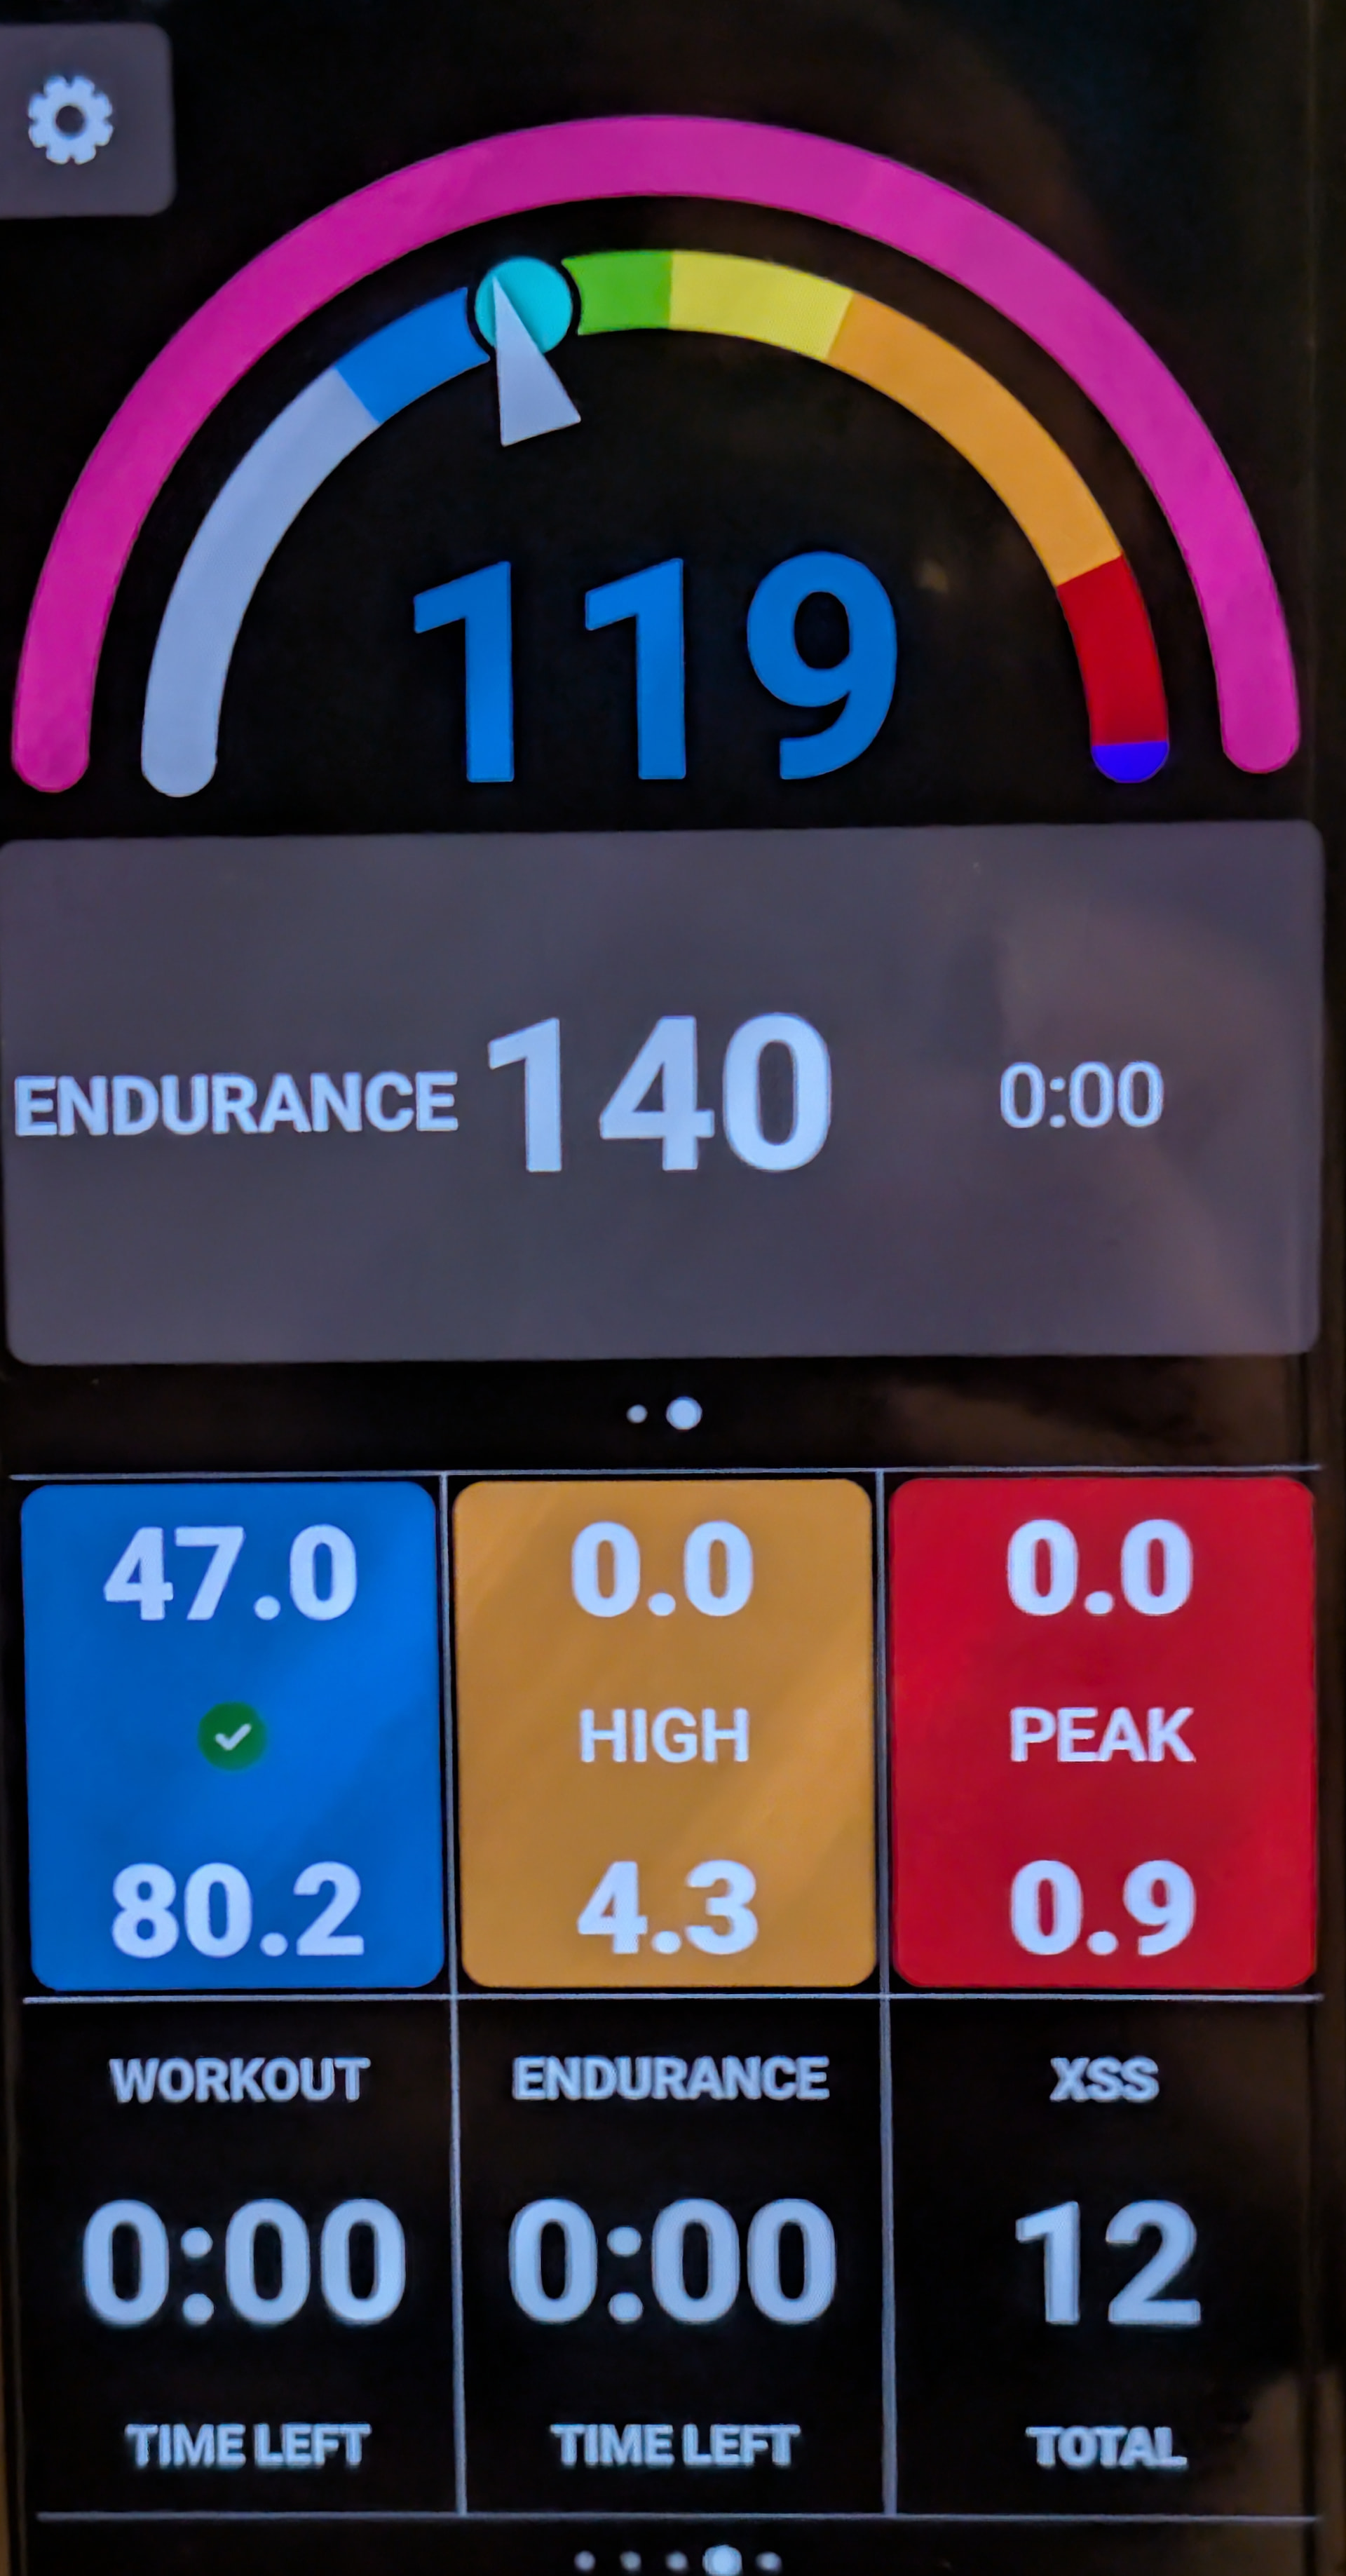
Did an outdoor ride recording on Edge 840… Again, very noticeable discrepancy between Connect IQ app and Xert backend calculations.

Here is the view of the app right before I stopped recording:

Values are the same as recorded in the FIT file, as can be seen on Garmin Connect:

image

However, Xert web site report different values:

Granted, the difference isn’t very large - 7% - but that breaks the trust in the app.

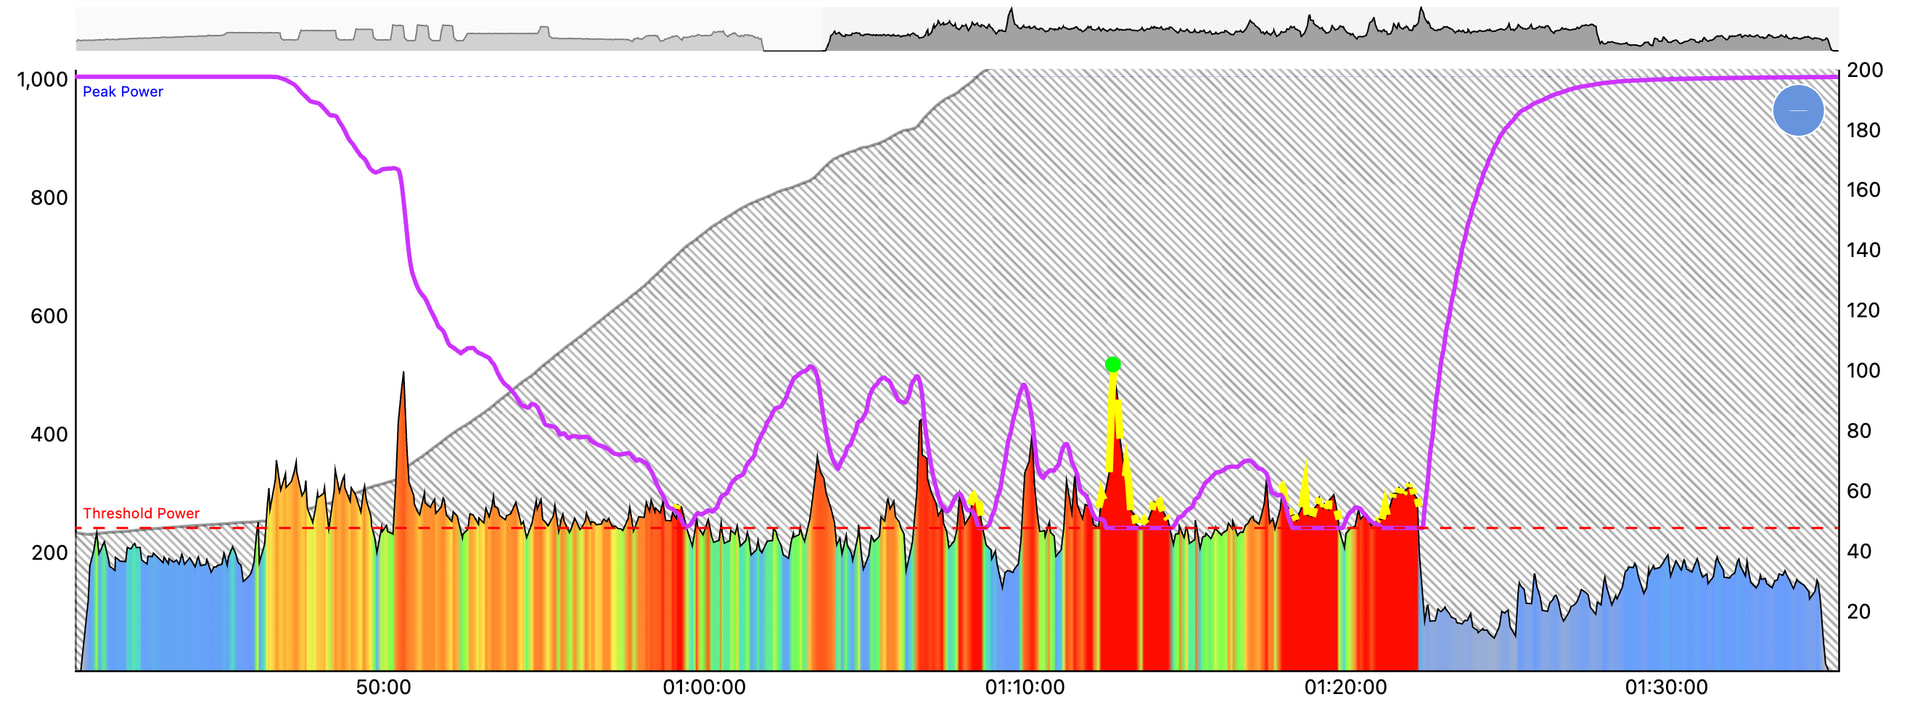
There was a silver breakthrough again, here is the power chart:

And back to another issue - target cadence. This ride was recommended as endurance, with fairy low power target which is fine, but 67 RPM cadence? You have to be kidding!

When having a breakthrough the values will be different. Xert online shows the xss values based on the new signature. The iq field dont do this and uses the old signature.

Re the cadence is the target based on analysis of your previous power/cadence relationship to give you the optimal cadence for the current power.

Those are reasonable deltas between the Garmin app and XO values.
In your case BTs are a contributing factor.
The numbers will never match exactly since the sec-by-sec analysis on the server is more precise than limited calculations performed on the Connect IQ or EBC apps.
In the vast majority of cases, the ratio achieved (low/high/peak) will match the target Focus for the day.
E.g. 163/11.2/1.55 is Mixed GC Specialist. So is 168/12.6/1.8.

Which sig values changed with your silver BTs?
As @elcomp mentions if BTs are detected during a ride (two on first screenshot; three on the second ride) and confirmed during post-ride analysis, that means the signature you started the ride with is different than the adjusted signature applied in the final analysis.
Ending XSS calcs will differ by design.

XMB cadence values include current cadence in upper left plus a Cadence Optimizer (Bioshift CO) represented by the small arc above current watts. That arc indicates your preferred cadence range at torque. I.e. the rpm values you normally ride at for any given watts.
The mid value (Noon position) is the number shown under TARGET CAD when the Endurance screen is displayed.
With XMB Endurance the goal is Z2 level watts with a default target of 88.5% LTP.
IOW ride easy at low watts which means lower cadence. The idea being your preferred cadence is more efficient but it’s only a suggestion.
I think there’s a difference between “preferred” cadence indoors vs outdoors.
I tend to spin more outdoors. The exception being climbs when I run out of gears.
On occasion I’ll reference the arc to perform low cadence drills staying below my preferred range. That’s done at higher watts though where the goal is to purposely grind on intervals.
I’ll also glance at the CO gauge indoors to remind me to lower my spin during RIBs (rest-in-between). Maintaining a high cadence through rest intervals just generates more heat. :slight_smile:

Reference: Using Magic Buckets in Real Time: Data Field Guide – Knowledgebase

Not exactly - probably, but the should not be that much different.

If breakthrough changes the signature - fine, but the activity was using my previous signature and should display numbers based on that - and only use new signature next time.

As I said - that erodes the trust in the tool because I cannot rely on any numbers - they change whenever they feel like. It is not the first time I notice Xert changes past data - freshness in planner is also a thing in itself (I posted about that before).

Also - signature changes all the time, not just as a result of the breakthrough. Moreover - if numbers in my signature go up, I would expect XSS numbers calculated based on that to go down - but that is not always the case.

Since I can see what Connect IQ app reported in Garmin’s FIT file analysis, I checked some other rides, without breakthrough - and I see similar behavior, for example:

vs.

image

It is very large difference between total XSS here!

As for cadence - no, 60 rpm is NOT my preferred nor normal cadence. I usually ride at ~85 on the trainer and at least 75 (but usually higher) outside. So I have no idea who would, in the right mind, recommend 67 rpm even for endurance ride - this is very bad recommendation overall - 60 rpm is a strength intervals cadence, not endurance or recovery.

That “very large difference”, between 191 and 183.7 (total XSS) is 3.9%. Seems reasonably close to me. We’ve applied some minor skew factors to the data fields, to help bias the data fields to err on the side of slightly under estimating the XSS you generate… since it is better if the server awards slightly more credit, rather than you stop right at your bucket targets and the server awards slightly less and you missed achieving the targets. So, ideally, where there is a couple percent variance, the server is higher.

(Side note - none of the activity charts show MPA data…viewing power data without MPA is missing half the context of the ride)

If you get a breakthrough (or near-breakthrough) on your ride, the XSS has to be recalculated with the new/updated signature, so there will always be some difference in those rides.

Most of the time, it’s rather trivial (within a few percent) and either:

  1. You got a BT ( :partying_face:) so final XSS is a bit lower (most users are content with achieving a BT)
  2. You got a near-BT ( :sad_but_relieved_face:), so the final XSS is likely a bit higher (signature goes down a bit, but you get more XSS credit for the ride)

It maybe 4% here, but other times it is higher.

What really bothers me here - the app and site display numbers with one tenth precision but it turns out that precision is fake. I can understand that there might be differences in processing power data online in Connect IQ app and backend may calculate aa bit differently - but I would expect that behavior to be properly documented and precision of displayed numbers aligned with possible variation.

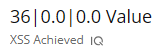
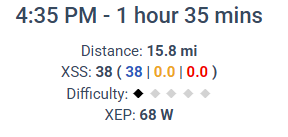
Breakthrough and higher power impacting XSS - sure, but low power produces different XXS too, here are the numbers from my yesterday’s leisure ride (RPE was about 1.5 :wink: )

image

BTW, that is more than 5% difference for very steady, very low wattage ride.

If you look at the screenshots I provided earlier, I got higher XSS in one case and lower in another - when there was a breakthrough each time:

163/11.2/1.55 → 168/12.6./1.8

268/25.2/6.4 → 249/23.1/6.1

I think you are missing the point I am trying to make - maybe this discrepancy is by design - fine, but then document it properly and stop using these “precise” numbers since that does not make any sense.

BTW, if there is a breakthrough during activity, it should still use the signature which was active when activity started, do not “backdate” the numbers, new signature would be perfect fit for the next activity.

And since Connect IQ app adds the resulting XSS in the FIT file - it may make sense to use it in the analysis - at least display it, otherwise this happens - I remember numbers when I finished the ride, I then go to look at the ride details online and I am met with completely different numbers without any explanation why that happened in the time it took me to park my bike, change and open Xert web site.

Let’s say a left crank power meter brand advises you to perform a zero-offset before every ride.
You forget to do that one morning and the ride is recorded without calibration.
Your power meter reads 10 watts low during the ride and your Garmin thinks average power was 181 when the actual effort was near 190.
What if you were able to perform zero-offset and calibrate the post-ride data to reflect the true effort?
Which number should the training software use?

With XMB you started the ride with an understated signature, proved that point by generating BTs during the activity, and the result is a corrected analysis. End of story. :smiley:

Couple this with the fact the Connect IQ (or EBC app) calculates a strain score without second-by-second precision and data filtering the server analysis provides.
The numbers will differ regardless of how many decimal points you carry the values to.

Your argument regarding that precision is …well, interesting feedback. :thinking:
Would it help if Xert added a tilde preface to every possible data point?
~261 TP
~180 XSS
~2.5 hours
~3.1 High XSS
~Rouleur (6 min power)
~62 Difficulty Score (2.5 Diamonds; Moderate)
~90 TL (3.5 Status Stars; Competitive)
~3.2 W/kg
~932 PP
~It’s tildes all the way down. :turtle: :turtle: :turtle:

BTW how were you able to ride that slow for an hour and 35 minutes?
What does the power chart look like?
Were you able to maintain ~85 rpm? :smiley:
38/1.583333333 :smiley: = 24.00000000505263 XSS/hr
I’m not sure how I’d rate the RPE intensity for that.

2 Likes

Comparing an error in measuring power - real physical value which actually can be measured correctly with calculations based on some estimated curve based on generalized physiological model - quite bad approach in my opinion. But even then - if I had a recording with bad power values - so what? Re-calculating the results will not affect my actual fitness at all, so who cares? I’d fix power meter and get proper values next ride (and fitness model will correct itself going forward) - there is no time machine for me to go back and do something to improve my training. But looks like Xert uses that “time machine” quite often causing values to change all the time - be it targets for a workout (yeah, these are targets I worked out for, not the result!) or how I was “tired” yesterday. Sorry, I don’t accept that - I want to look forward, not backward!

It would be fine by me if Xert would preface all numbers saying they are estimates and may change depending on tomorrow’s weather :wink: Seriously - be honest, if you want to recalculate post-factum - preserve and show original values, this will only benefit users.

Oh, that was really hard, I train for that a lot :smiley: - it was a leisure ride along the beach with my wife.

No, I didn’t target that, but probably could have done that if I wanted.

Average cadence was just 60… Would it help if I flag this ride to avoid that stupidest 67 rpm recommendation for endurance rides? (It is probably easier to ignore that cadence recommendation though).

I rated RPE at 1.5 because there were couple of spikes :stuck_out_tongue:

Absence of axis labels does not help, btw.

I had to split my total endurance XSS today into two rides - outdoor first and then indoor.

I usually record my outdoor rides on Garmin Edge 840 - and this time was no exception and I noted that I did a bit over half of daily target, good.

Sometime later I went to my trainer and decided to not just ride for whatever time I knew I need to get the rest of XSS, but also record this on Android app.

I been tempted to record some internal ride on both Edge and Android an then compare that to whatever Xert backend calculate… did not do that so far only because I don’t want to be disappointed in Xert XSS calculations even more :frowning:

But anyway - back to today’s ride - I was half-expecting for the Xert EBC app to be aware that I already used up half of my target - and indeed, it was - it showed me how much I already did today.

However, to my surprise - it showed as target not the total daily target, but what’s left for the day. And then started to increment XSS in the “already completed” count.

It just does not make any sense - my daily target was something like ~113, I already completed 65 so what’s left was about 48 (ok, 47 with the backend adjustment). But low bucket started to fill from 65 - which is already more than 47 as displayed in the app!

It should be either:

  • display full daily target regardless of how much was already completed, then the amount of “completed” fills up toward that total
  • Keep only remaining XSS but then start the session from 0 XSS completed

The way it is currently shown in the app does not make any sense:

Wonder, if this is being tested before the release at all…

Thanks! We’ve already identified this bug and will resolve it with the next update to the Android EBC app.

1 Like

Regarding your overall point about recalculating XSS after the activity, I can appreciate why this would be confusing until you understand what’s happening behind the scenes.

The rationale is fairly straightforward. Let’s say you start a ride with a Threshold Power of 250 W, but during that ride you demonstrate that your actual fitness is higher and Xert extracts a new TP of 260 W. When we perform the final analysis of that activity, we believe it makes more sense to use the newly validated Fitness Signature rather than a signature that the activity itself has demonstrated was underestimated (incorrect, if you will).

This becomes particularly important with Breakthrough activities. I noticed that MPA is hidden in your screenshots, but during a Breakthrough it’s quite common for your power to exceed the old MPA. By definition, you cannot actually produce more power than your Maximum Power Available—the fact that you did tells us the starting signature was no longer representative of your fitness.

Here’s a fairly extreme example from one of my recent races. Using my starting signature, I spent roughly 25 minutes “above” MPA, and the real-time calculation awarded me ~236 XSS for a ~40-minute race (and a max difficulty of over 230!!):

Clearly, I wasn’t actually riding above my maximum for 25 minutes. :slightly_smiling_face: The model simply didn’t know my updated fitness yet. Here’s what the data should look like using a valid signature:

There’s an old saying in statistics: “All models are wrong, but some are useful.”

Xert is ultimately a model of your physiology, and its usefulness depends on the quality of the inputs we’re giving it. If an activity provides new evidence that the starting Fitness Signature was no longer representative of your fitness, it makes sense to update the model with that new information.

Once the activity establishes a more appropriate signature, recalculating MPA, XSS, Difficulty, etc. with that signature gives us what we believe is a more accurate and useful representation of the activity.


That being said, I do understand your broader point: ideally, the real-time and post-ride numbers wouldn’t disagree in the first place.

One thing we’re considering with the Xert 2.0 model is allowing our mobile apps to update/recalculate the Fitness Signature (and therefore MPA, XSS, etc.) during the activity itself. That would ultimately be a better solution because the real-time calculations could adapt as new fitness is demonstrated rather than waiting for post-ride analysis.

In the meantime, there’s actually a useful way to compare the two approaches. When viewing an activity, click PREVIOUS underneath the MPA chart. That applies your previous/starting Fitness Signature to the activity, allowing you to compare the chart and metrics against the final analysis. This is exactly what I did to get the screenshots above.

I’d be curious whether comparing PREVIOUS versus the final extracted signature helps explain why we believe the recalculation is necessary.
5 Likes