I am sure this has been asked, but I could not find it with the search function. This isn’t the only instance of this happening but last night I had a workout where my head unit said I earned a gold breakthrough, and I had filled or overfilled all of my magic buckets. However once uploaded I had only gotten a silver breakthrough and was low on my High and Peak buckets. I had just happened to take a photo of my computer last night because I had finished a 3 hour ride in about 70 min and was sharing with my buddies.
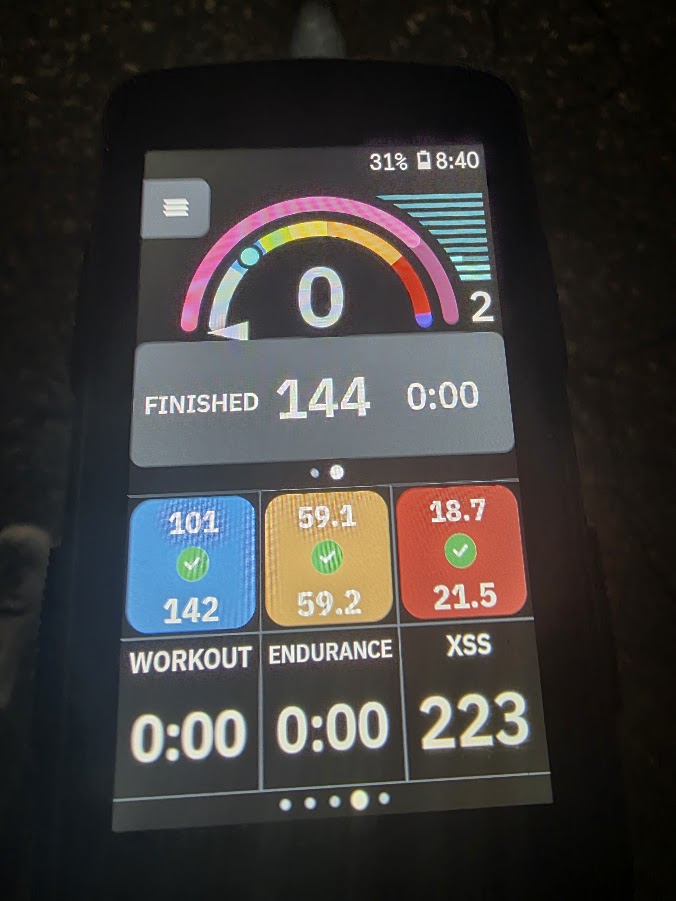
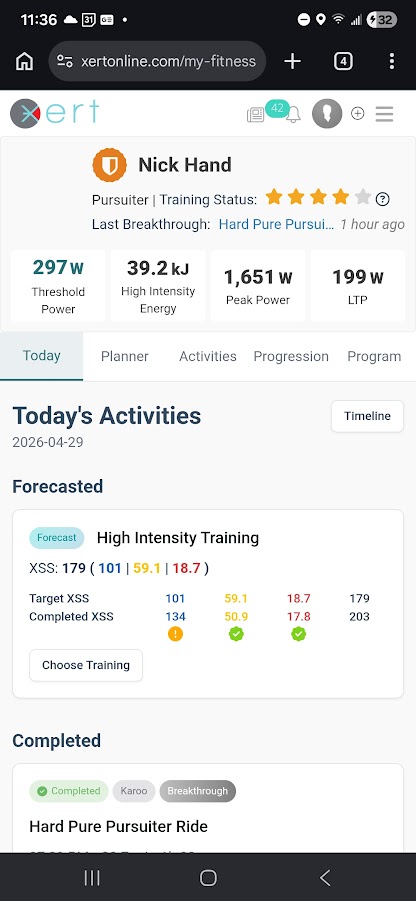
Same issue as with the Connect IQ app. Post-ride analysis is more precise on the server along with some data filtering logic.
However, I think you may need to tweak your signature, or perhaps it was not synced to EBC before the ride. 
Post the BT report or the Previous chart shown under the activity details.
Was it a non-stop series of road sprint intervals?
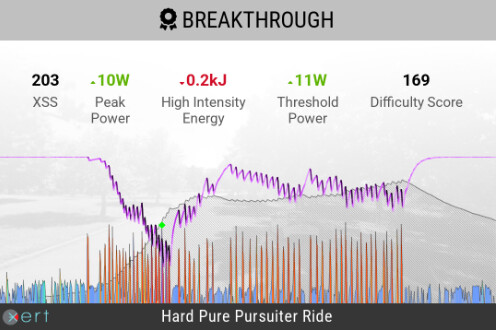
Yes it was, this is basically what my intervals always are. Not complaining, it has completely transformed my racing. Just earned enough points to get my cat 1 upgrade after being a 2 since 2014.
2 Likes
When you achieve a BT, your updated signature is applied to the activity’s power data which downgrades the XSS values you saw during the ride.
With the higher TP the watts add up to lower values since you’re stronger than what EBC thought you were during the ride. 
That was some serious hammering especially during the first block that reached Challenge Level 10 and triggered the BT. Looks like multiple BTs in your case which you can see by viewing the Previous chart (pre-BT) under the activity details.
tl;dr: Garmin datafields seem buggy. Where is the up-to-date manual for Garmin datafields?
I have a same problem/question. I’m using Garmin 840 and Xert Magic Buckets and Dashboard Connect IQ fields (configured on separate pages).
Link to completed activity: Xert - Activity | Tough Mixed Rouleur Ride
This is what Xert website shows:

At the end of the ride both Garmin datafields showed completely different picture. Low was 248, High was 32, Peak was 7.3. I had a breakthrough and threshold power increased by 20W from 248 to 268. Before the ride Xert suggested duration ~3:16, since I filled all the buckets are I did a shorter ride ~2:17.
Something similar has happened to me before (on Wednesday):
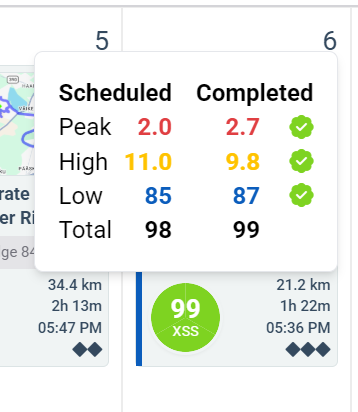
After ride Garmin showed higher values for High and Peak, but I do not recall what they were.
Right now I’m really disappointed with the Garmin datafields. More than 2x error compared to after-race analysis makes it worthless in my opinion if you say that this is normal or expected behavior. It makes me think that there most be some bug in the system.
Another question: is there up-to-date user manual for Garmin data fields where everything that is displayed is explained?
There is so much going on in both the Dashboard and Magic Buckets fields, but I haven’t found the explanations what all those colors and signs and what not mean. When I’m doing my best to achieve breakthrough it is really hard to decipher what the Garmin is trying to tell me. E.g. at some point the outer red arc went to zero (leftmost position) and then turned dark blue. What does it mean? I noticed that Dashboard showed some notifications about breakthrough after 30 seconds at some wattage. I continued to pedal at high intensity. Then after much longer interval another notification come for lower power @ 30 seconds but I was never notified about breakthrough. Magic Buckets data field didn’t say anything about breakthroughs. Is it expected?
If the XSS values between Dashboard and Magic Buckets don’t match check to make sure both data fields are current release editions.
As of May 6th that is v6.5 for XDB and v10.8 for XMB.
If the activity results in a BT, the post-ride analysis values won’t match in-ride numbers since your signature has changed. If TP increases the distribution between Low and High/Peak has changed.
Here’s is a forum post describing the rainbow gauge functionality common to Xert apps/data fields that display it –
Did you know… Xert Rainbow Gauge - General - Xert Community Forum
Magic Buckets (for Garmin) has several nuances that have been posted on the FB users group.
Do you have access to FB? If so, you can peruse the media library there for tips.
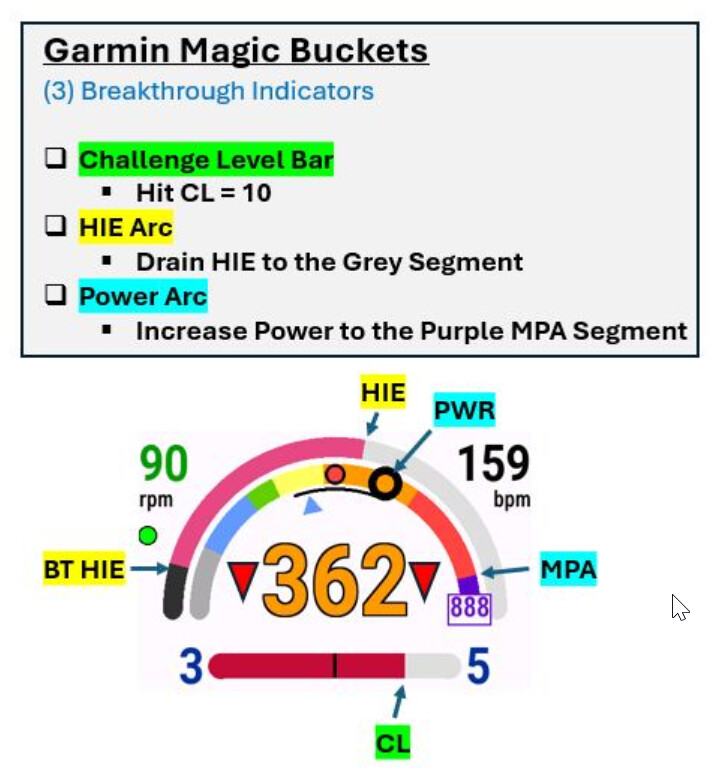
For example, here’s the three BT indicators available on Garmin XMB:
I do not have the latest versions of the datafields. Dashboard was either 6.2 or 6.3, so quite recent. I will update them. But they both showed same values. Their changelogs did not list any relevant changes that would explain drastically different values compared to web.
Do you know if it is possible to calculate XSS for activity using the previous fitness signature? I would like to see how different those numbers will be from the ones that I saw during ride.
If the Garmin cannot perform the real-time calculations as accurately as Xert server then the error should still be reasonably small - like 5%. Otherwise, how can I use it for training if the error is so big?
Thank you for the link to forum post explaining the gauge and also this image from Facebook. Those were helpful. I do not use Facebook, so I cannot see any content there.
It is good that there is some info in the forums, but I believe that system should have up-to-date manual.
I still do not understand what it means when the HIE arc turns dark blue. It seemed to grow as I rode harder, but I’m not sure what it meant.
1 Like
The numbers between apps/fields and server WILL be close UNLESS a BT occurs during an activity that alters your TP substantially.
They won’t be exactly the same with no BT detected since the XO server provides second-by-second analysis with data filtering not possible on the app/field.
If you feel that TP jump wasn’t warranted, you can flag the entry to remove the signature extraction while retaining the strain score based upon prior signature.
Post the BT report from that activity so we can see what type of BT occured.
An abrupt stop during a pull-down BT can fool the algorithm and result in an invalid adjustment. That’s when flagging or manual adjustment comes into play.
Thank you for help and advice and sorry for being grumpy.
I did some experiments to understand why there are such discrepancies.
First of all I’m using older versions of Dashboard and Magic Buckets: 6.2 and 9.8. I know that newer versions have improved the buckets calculation to match with calculations in the main system. I will update the widgets and see how much difference there is.
Secondly I had a breakthrough. TP increased 8% or 20W. It does not seem big change but it actually was.
Thirdly I was using Auto Pause function. Out of 2:17 I was paused for four minutes. I’m not sure but I believe based on my experiments that when activity is paused widgets do not perform the calculations. It means that activity seems to be more intense to widgets because they do not “see” those four minutes when I was actually resting.
I took the FIT file of the problematic activity and replayed it to Garmin using FIT ANT+ Playback tool GitHub - wolframmanta/Fit-ANT-Playback · GitHub
First I set up my account like it was when I first did the activity with TP at 248W and replayed the FIT file (only powermeter data, no HR).
Low was 220, high was 26, peak was 5.5.
Then I set up my account with new signature, TP at 268W and replayed FIT file again.
Low was 177, high was 15, peak was 3.2
For comparison main system calculated low 166, high 13, peak 2.8 and the original values that I remembered from original ride were low 248, high 32, peak 7.3.
So, right now I believe the differences between those four sets can be explained by three factors:
low 248, high 32, peak 7.3 (original from garmin) vs low 220, high 26, peak 5.5 (replay@248 from garmin) → autopause
low 220, high 26, peak 5.5 (replay@248 from garmin) vs low 177, high 15, peak 3.2 (replay@268 from garmin) → different signature
low 177, high 15, peak 3.2 (replay@268 from garmin) vs low 166, high 13, peak 2.8 (from web) → old version of the widgets.
I will update the widgets and do two more tests.
I will also switch off Auto pause and see if that has influence on the calculations.
Hi Arne, thanks for the feedback!
I’ve been working hard to get much of our content updated & refreshed. This will hopefully have some of the information that you’re asking about - Using Magic Buckets in Real Time: Data Field Guide. Note this article also includes the UI for Hammerhead/Android.
I don’t have anything specific created at the moment for the “rainbow gauge”, but that could be good to have as well.
Thanks! When I did my experiments I filmed the Garmin during the breakthrough: https://www.youtube.com/watch?v=P9RpSJXbEsI
One thing that I learned is that dark blue color means breakthrough. When the Watt number turns dark blue then the breakthrough is in progress.