When you hit more details you get a little graph. See attached. The colors in the line graph don’t match the colors used for low hi peak. Maybe they’re not supposed to but then what is the graph displaying?
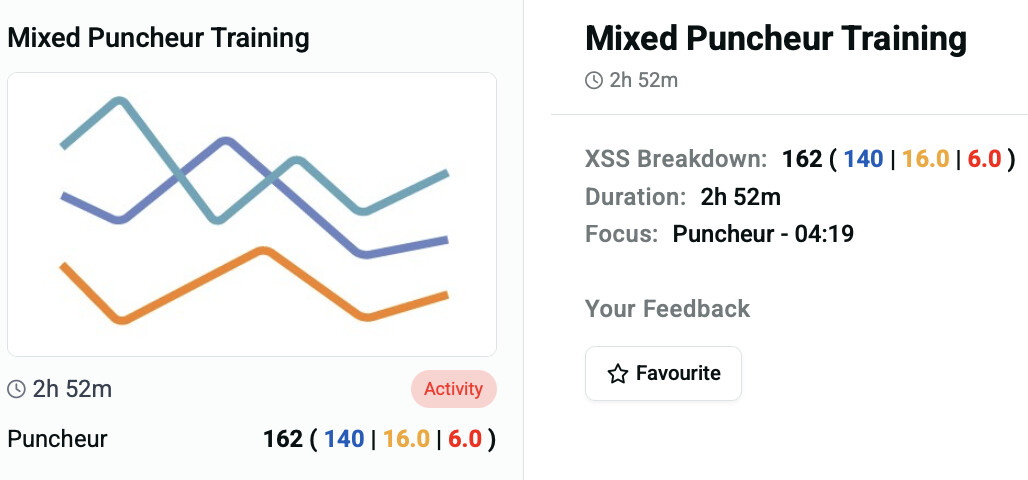
Looks like a stock image representing a graphical chart for an activity that can’t be charted.
What is the source for that activity?
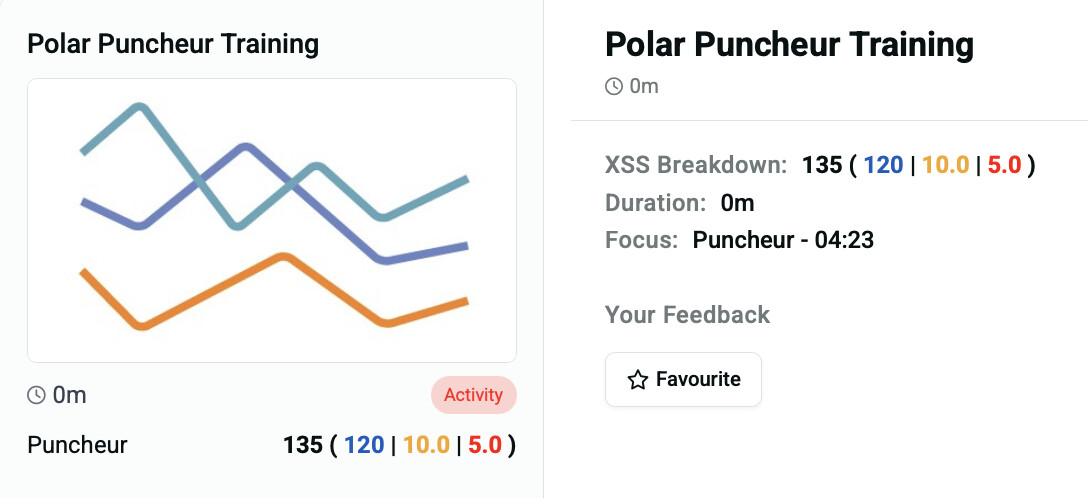
It looks like a generic chart of some sort. It’s showing the same thing for a workout I have not yet done, scheduled for today. Hitting more details in the screenshot above will get you the chart

Now I understand what you are looking at.
The generic chart image is displayed when you select the Manual tab option for the day.
I.e. you opted to select generic entries of Mixed Puncheur and Polar Puncheur.
There isn’t a specific activity/workout selected to display a thumbnail chart.
Instead, you have XSS targets for Low, High, and Peak, good for Magic Buckets free rides.
It would be helpful if the Manual tag were shown which does appear on the Planner when viewing on a desktop, but not on the Today tab or in any mobile views.
What is the graph then? Artwork of some sort? I don’t get what it’s conveying
It’s not conveying anything. It’s a placeholder image where a thumbnail chart would appear if a workout or past activity were selected instead.
I suppose they could display a different image such as –

yeah ok true
Thanks Patrick. Yes, this is a placeholder image if the activity/workout doesn’t exist or can’t be generated. Perhaps we can think of something better to show here.. ![]()