Hello,
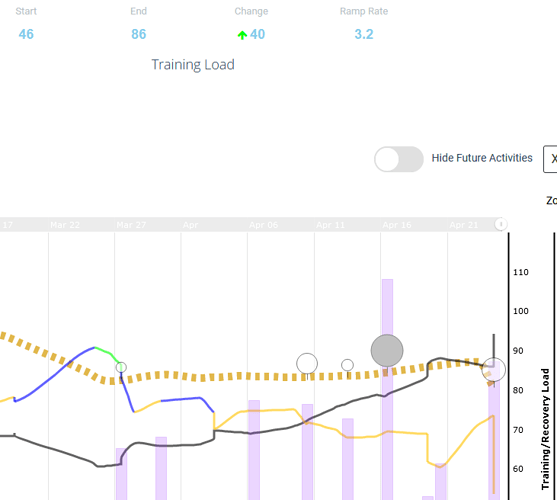
I have a bug with the value of TL . 86 instead 94 on graph
Hello, no idea ?
I believe the issue is a screen anomaly due to how the charting tool handles ending entries onscreen.
Same reason the recovery load line dips straight down.
The numbers are correct in the table which is what XATA uses (weighted moving average XSS rate over a 7-day period).
Be sure you’re considering the time differences. The chart only shows up until your last activity, including future planned ones. The table shows you the data as of now.
