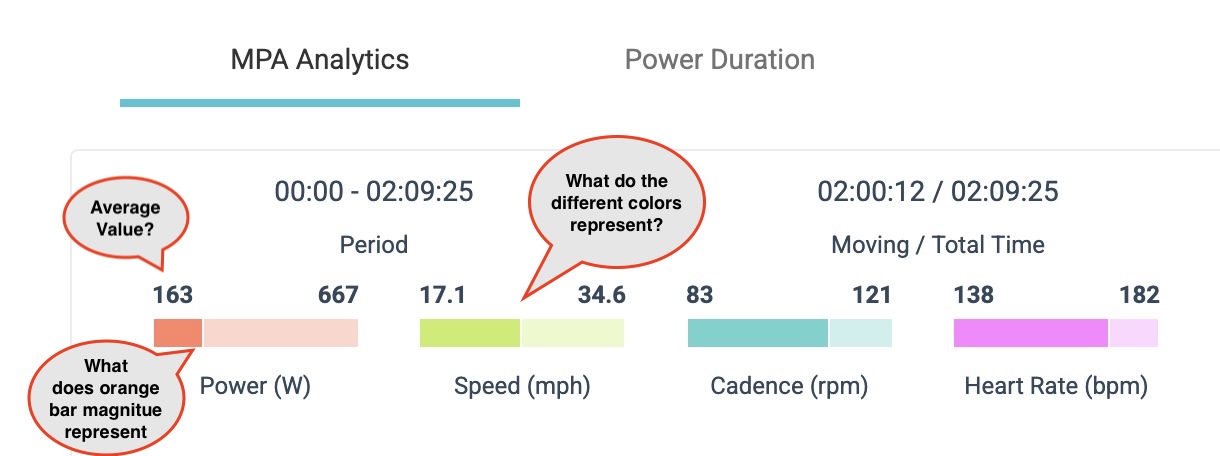
Would appreciate an explanation of the meaning of the color bars and their magnitude for power, speed, cadence, and heart rate.
I think the number at left of each bar represents the activity average and the number at far right indicates the max value for the activity. Is this correct?
What do the different colors represent for each bar?
Good questions - we might be making some changes to this, but I can answer these for now!
Left number is the average value (depends on your moving time setting) and the right value is the maximum value. The filled in portion of the bar shows how close the average value is to the max (the lightly shaded portion of the bar).
Thank you Bob. That is helpful. I’ve been trying to figure it out for a while. I’m not sure how helpful “how close the average value is to the max” is to me but its good to know what it means.
I do hope you make this a better representation, it is not visually intuitive, it would normally be: low, high and average numerically and visually over the dark bar end.